
Few chart signals are as appealing as RSI divergence. Price makes a new high, RSI does not, and the move looks tired.
The trouble is that divergence appears often, and price frequently keeps going. This article looks at why, what tests have found, and how to filter out the weaker signals.
What RSI Divergence Is
Bearish divergence is a higher price high with a lower RSI high. Bullish divergence is a lower price low with a higher RSI low. This article covers regular divergence, not the hidden kind.
The idea is that momentum fades before price turns. The weakness is that fading momentum is not the same as a reversal.
Why Divergence Fires So Often
RSI compares average gains with average losses, over 14 bars by default. A slower climb can produce a lower RSI peak even while price keeps making new highs.
In a strong trend that happens again and again. The chart below shows three warnings on one simulated uptrend.
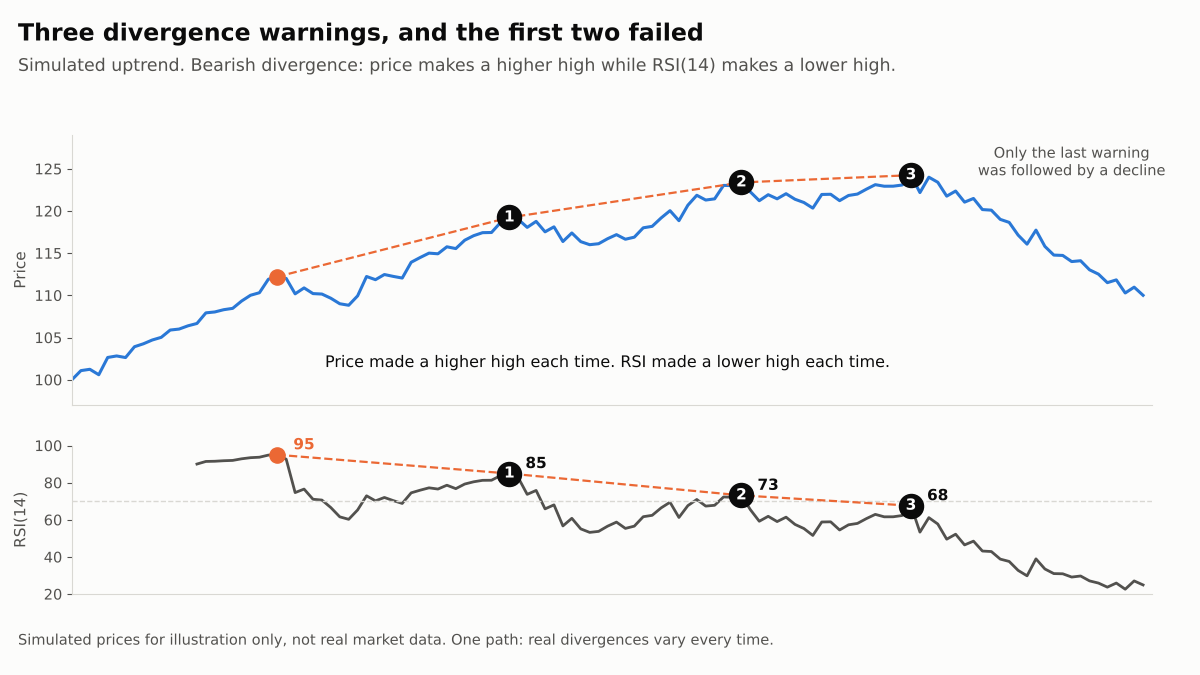
Price rose 10.7% from the reference high to the third warning before any real decline. A trader who sold at the first signal would have been stopped out.
There is also a judgement problem. Which peaks you compare changes the answer, so two traders can draw different divergences on the same chart.
What Tests Have Found
Thomas Bulkowski ran a test of RSI divergence on 994 stocks from 1995 to 2010. He used every price peak and valley at least eight days apart, a total of 19,294 samples.
Bullish divergence beat the S&P 500 consistently only in bull markets. Bearish divergence did not do what it promises: in his words, “Stocks showing bearish divergence should decline more than the index but don’t.”
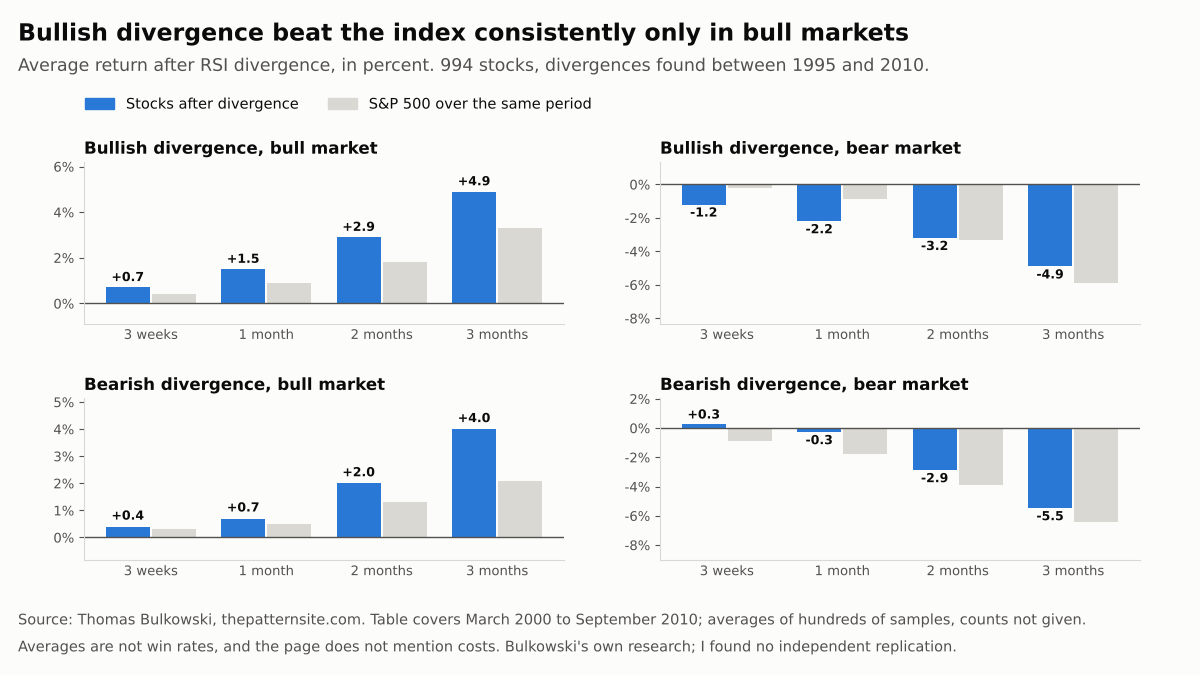
Bulkowski also reports how often divergence beat the index. His main table showed 50% to 55% for bullish divergence. From a 1995 start, it fell to 45% to 48%, which he summarises as failing “more often than it works”.
Treat this with care. It is one researcher’s own work, the published table is partial, success is measured against the index, and the page does not mention costs. I found no independent replication.
A Transparent Backtest, With Caveats
Backtrex, a backtesting app vendor, published a ten-year test of RSI divergence on the DAX. It used 4-hour candles, a 1.5% stop, a 3% target and 0.02% commission per side.
The result was 106 trades, 38.7% of them winners, and 65 stopped out. Total return was +16.5%, against +136.4% for buy and hold.
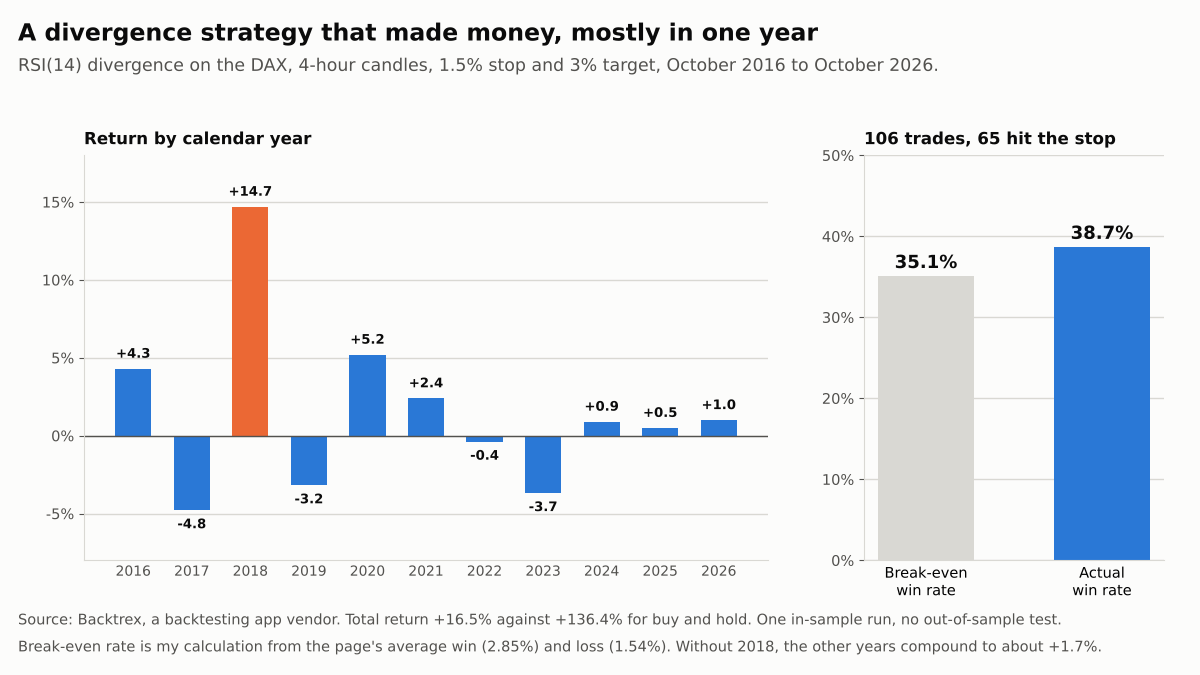
Using that page’s average win and loss, the break-even win rate was about 35%. The edge was thin. The page itself notes most of the gain came from 2018, and the other years compound to roughly +1.7%.
What Practitioners Warn About
Arthur Hill of StockCharts wrote that most divergences are at odds with the bigger trend. He added: “I can usually find more failed divergences than successful divergences.”
His filters are to take bullish divergences only when the larger trend is up, and to ignore bearish ones near 52-week highs. This is a practitioner article with hand-picked examples. It gives no hit rates, and I found no test of his filters.
A Worked Example
Use the simulated chart above. A trader sells short at 117.52 once the first swing high of 119.22 is confirmed. The stop goes 1.00 above the high, at 120.22, which risks 2.70 per share.
Price later reached 123.38, so the stop was hit. With $200 of risk, the position is 74 shares and the loss is about $200.
A 2 to 1 target would need the trade to win about one time in three to break even, before costs. Our guide to risk-reward ratio and win rate explains the trade-off.
How to Cut the False Signals
- Define divergence objectively. Fix the RSI length and how far apart the two peaks must be, as Bulkowski did with his eight-day rule.
- Wait for confirmation. Require price to break the last swing low before selling, instead of trading the divergence itself.
- Respect the larger trend. Treat bearish divergence in a strong uptrend with extra caution.
- Test every divergence, not just the winners, with realistic costs and a held-out period, as in our backtesting guide. Avoid tuning settings until it looks good, which is how overfitting starts.
- Add a price level. Our guide to finding strong support and resistance and the bullish pin bar at resistance show how to test a signal at a level.
Key Takeaways
RSI divergence often warns early, and in a strong trend it can warn repeatedly before price turns.
The best test I found had bullish divergence beating the index consistently only in bull markets, and the other evidence is thin. Treat divergence as a prompt to look closer, wait for confirmation, and test it on your own market before relying on it.
This article is for educational purposes and does not constitute financial advice. The worked example uses simulated, hypothetical figures. Trading stocks and forex carries a high level of risk, including the potential loss of the full amount invested, and may not be suitable for all investors.
Leave a Reply