
Support and resistance levels are an invaluable technical analysis tool in any financial market, especially forex.
The drawback is that reading support and resistance levels is subjective, and the outcome depends heavily on the user. This article will help you understand how to find strong support and resistance levels.
Why support and resistance levels are important
Support and resistance is probably the first thing you learn when beginning your trading journey; it’s one of the many ways traders can interpret supply and demand from charts, and supply & demand is what ultimately moves a market.
The concept is relatively simple; support levels occur when buying pressure increases as buyers believe the price is good value to buy, whereas resistance levels occur when selling pressure increases as sellers decide the price is beneficial for them to sell.
Interpreting support & resistance levels can be tricky. Different circumstances have different meanings and outcomes. Let’s explore a few examples highlighting how to find strong support and resistance.
Weak vs strong support and resistance
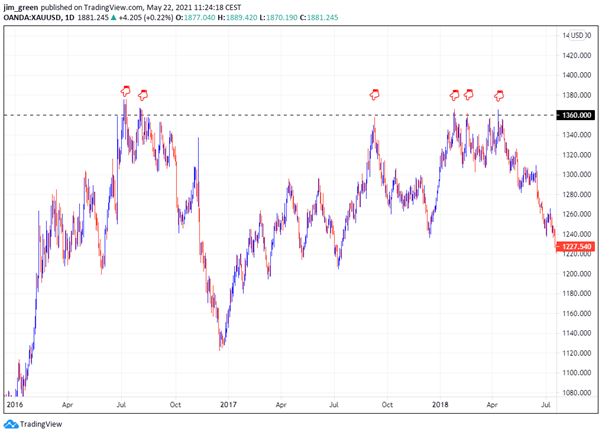
In the chart above, we have a strong resistance line for gold at $1,360, where the price touches this level six times over two years. Each time the price approaches or passes the line, it’s rejected and falls back.
This show buyers were unwilling to pay much more than $1,360, indicating the peak of gold’s value. It wasn’t for another twelve months until the price finally broke this level.
What makes this example a strong resistance level isn’t just the number of attempts to break the line or the timeframe but the extent of the price swings approaching the levels.

The image above shows weak support and resistance levels. Firstly, we’re looking at a five-minute EUR/GBP chart between 17:00 and 08:00.
The price is simply bouncing between a 7-pip range. As the market approaches the start of the session and volume increases, the price effortlessly breaks through the support.

https://www.tradingview.com/x/DU5CbSNC/
In this EUR/CHF daily chart, we see an example of how strong support and resistance levels reside by round numbers.
Going from left to right, you can see strong resistance at the 1.20 level. On two consecutive days, the level is touched, and the price fails to advance for the following two weeks.
This chart also demonstrates that former support levels can later become resistance levels and vice versa.
Look at the 1.145 level to see this in action. Although this level doesn’t start as a perfect support line, it becomes a resistance level that’s tested several times over six months.
Top tips for finding strong support and resistance
- Zoom out and look at the bigger picture. If a support or resistance level is maintained for a longer period, it’s more likely to hold strong. A resistance level on a daily chart will be stronger than a resistance level on a five-minute chart.
- Levels are not definitive. Don’t consider levels as absolute numbers, rather look at them as zones. A price can easily touch and pass a support line but still bounce away from the price later.
- Volume is needed to break support and resistance levels. Slower trading periods, such as summer months and Christmas, are associated with stronger support and resistance levels.
- A surge in volume can cause a breakout. During periods of lower volume, less volume is needed to move the market. Consider trading desks wanting to close out their positions on a Wednesday evening before triple-rollover or on a Friday to ensure they’re flat over the weekend. Sometimes closing the position is more important than the price.
- Fundamentals can break the strongest support and resistance levels. Consider an event where traders care more about fundamentals than technical analysis, such as a world-changing event or significant market news.
- Don’t confuse swing-highs and swing-lows with support and resistance. Although swings are minor forms of resistance in a trend, they are generally weak and very likely to be broken in the course of a trend. A support or resistance level encounters multiple touches and rejections at a specific level and, therefore, a stronger price barrier.
Conclusion to finding strong support and resistance
In this article, we looked exclusively at static horizontal support and resistance levels. Depending on the instrument and timeframe you’re trading, you might find you can discover stronger levels using trendlines following several swing highs and swing lows to find support and resistance within a trending market.
For more advanced traders, a Fibonacci retracement tool might differentiate stronger and weaker levels. And finally, a popular technique is to use dynamic support and resistance levels. A common indicator used for this is the 50-period simple moving average.
Leave a Reply