
Every breakout trader has been caught by one. Price pushes through a level, you buy, and within hours it is back where it started.
A failed breakout strategy turns that around. Instead of buying the break, you wait to see whether it fails, then trade the reversal. This article covers what the data says about how often it happens, how traders approach it, and where it goes wrong.
What Is a Failed Breakout?
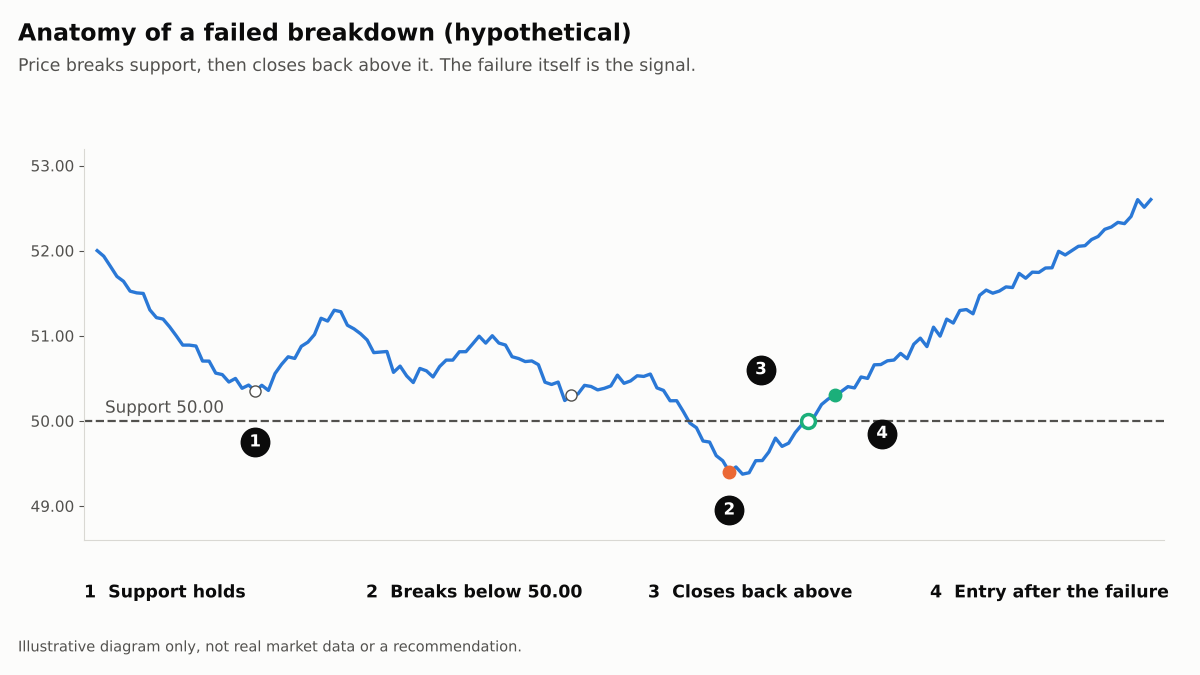
A failed breakout is a move through support or resistance that does not hold. Price closes back on the original side of the level.
Traders call it a false breakout, a fakeout, or a bull or bear trap. Thomas Bulkowski calls it a busted pattern: a breakout that moves no more than 10% in its direction, then breaks out the other side.
He says the 10% limit is arbitrary. Any threshold you pick is a judgement call.
How Common Are Failed Breakouts?
More common than many traders assume. Bulkowski’s busted pattern statistics show a median bust rate of 24% for upward breakouts and 40% for downward ones, across many chart pattern types.
Most busts happen once. Still, a pattern can bust again after the first reversal. The page reports three or more busts in 16% of upward cases and 28% of downward ones.
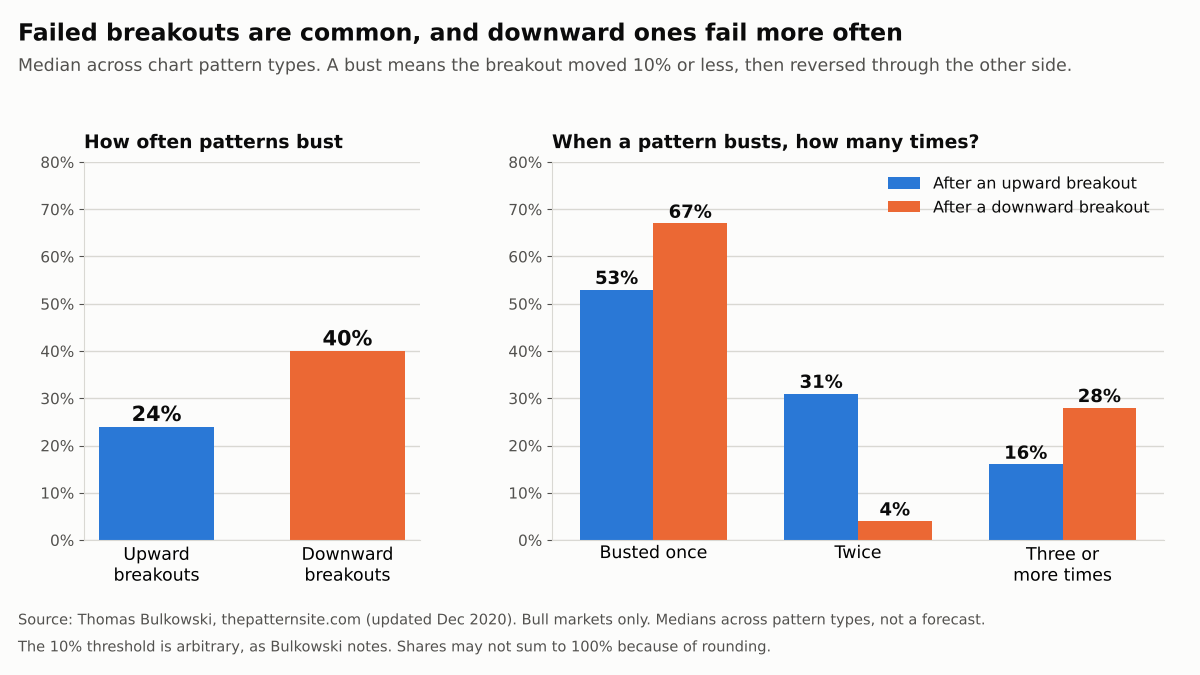
Treat these as rough guides. They are medians across many patterns, from bull markets only, and come from one researcher’s own work. I could not find independent replication.
Why Do Breakouts Fail?
Nobody knows for certain. One explanation is order flow. A level attracts stop and entry orders, so a push through it can set off a burst of trading with nothing behind it.
C. L. Osler’s New York Fed study of currency orders found stop-loss orders clustered just beyond round numbers. That was one bank over about eight months, so it supports the idea without proving it.
If the burst runs out of buyers or sellers, price slips back. The traders who entered on the break are then trapped on the wrong side.
Do Busted Patterns Perform?
Bulkowski reports that busted patterns often rose further than normal ones. In his bull-market tables, a downward breakout that busted and reversed up averaged larger gains than a normal upward breakout in six of seven comparisons.
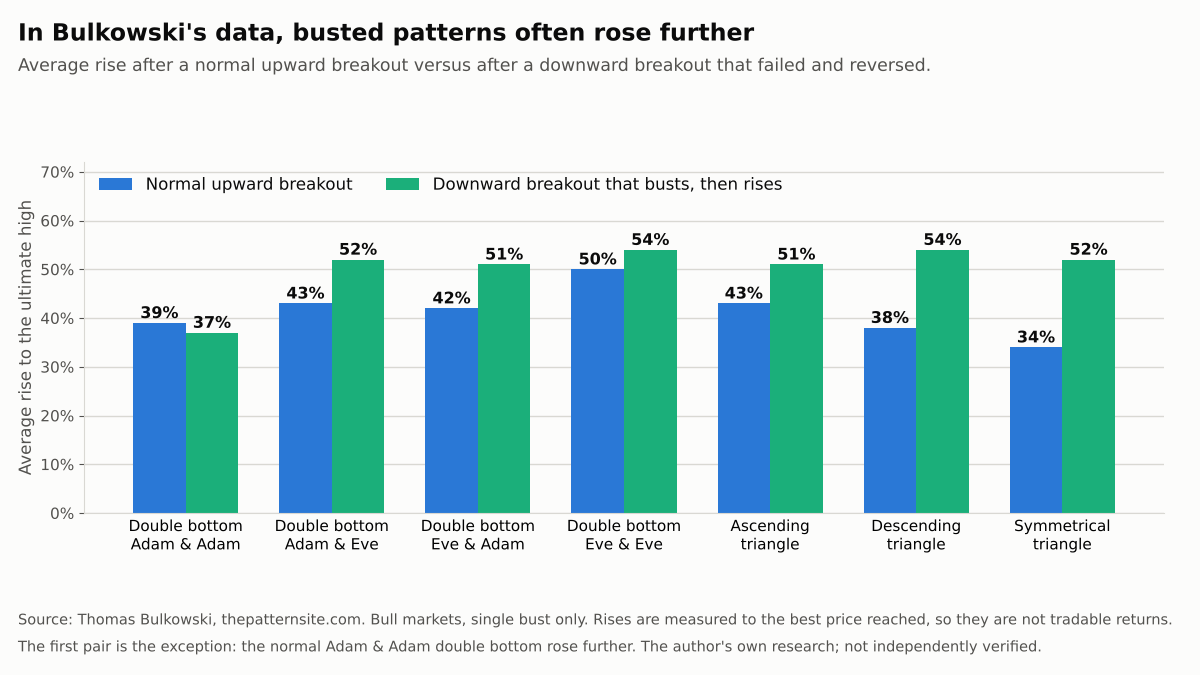
Be careful with that chart. The rises are measured to the highest price reached, which no trader can exit perfectly. It excludes costs, covers bull markets only, and is the author’s own research.
Bulkowski also suggests favouring busted downward breakouts, which are long trades. His reasoning is that a stock’s upside is unlimited, while a decline can only go to zero.
How Traders Approach It
Most versions follow the same sequence. The details vary, and I found no study showing that any of them beats simply buying breakouts.
- Mark a level that has been tested more than once. Our guide to finding strong support and resistance covers how.
- Wait for the break, then the failure. Do not fade the first spike. Wait for a close back across the level.
- Enter after the failure is confirmed. Place the stop beyond the extreme of the false break.
- Pick a target in advance. This could be the other side of the range or a multiple of the risk.
A Worked Example
Suppose, hypothetically, a stock holds support at 50.00 twice, then breaks down to 49.40. It closes back above support at 50.20 and you buy at 50.30.
The stop goes at 49.30, just below the false-break low. That risks 1.00 per share. A target at 52.30 would earn 2.00, a ratio of 2 to 1.
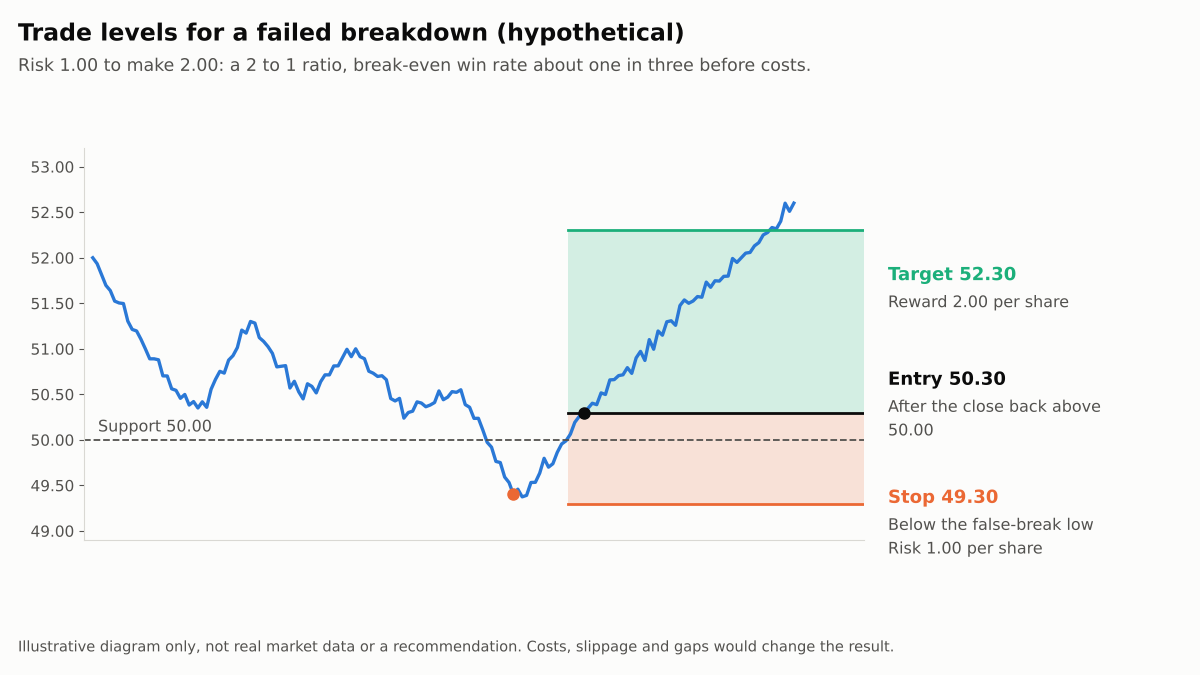
You would need to win about one trade in three to break even, ignoring costs. With $200 of risk, the position is 200 shares. Our guide to risk-reward ratio and win rate explains the trade-off.
Where It Goes Wrong
The main risk is that the failure fails. Using Bulkowski’s medians, about a third of downward busts and nearly half of upward busts bust again.
Other problems are practical. A tight stop sits close to the noise, a gap can jump it, and wide spreads at a level can erode the edge. Our article on the gap that fails shows how quickly that happens.
How to Test It Fairly
- Define the failure precisely. Decide how far past the level counts as a break, and how many bars you allow for the close back inside.
- Test every break, not just the failures. Include breaks that held, or the strategy will look better than it is.
- Use realistic costs and a held-out period, as in our backtesting guide, and avoid adding filters until it looks good, which is how overfitting starts.
- Compare with related setups. The inside bar false breakout and the bearish pin bar at support are related ideas you can test the same way.
Key Takeaways
Failed breakouts are common enough to trade, but the evidence for profiting from them is limited and mostly one researcher’s.
Bulkowski’s data suggests busts are frequent and often followed by large moves, but with important caveats. Define the failure in advance, size for the stop being hit, and test on your own market before risking real money.
This article is for educational purposes and does not constitute financial advice. The worked example uses hypothetical figures. Trading stocks and forex carries a high level of risk, including the potential loss of the full amount invested, and may not be suitable for all investors.
Leave a Reply