
Buying a dip in an uptrend sounds simple. The hard part is knowing when the dip is over, and that is where indicators come in.
Traders swear by moving averages, RSI, Fibonacci levels and price levels. This article looks at what each one actually tells you, what tests have found, and why the honest answer to “which is best” is “it depends”.
What a Pullback Indicator Does
A pullback entry tries to buy a trend at a better price after a temporary dip. The indicator is meant to answer one question: is this dip deep enough, or finished?
Different indicators answer it in different ways. Some measure distance from an average, some measure how oversold a market is, and some mark price levels where buyers might return.
Four Signals, Four Different Entries
The chart below runs four common signals on one simulated pullback. Each fires at a different price.
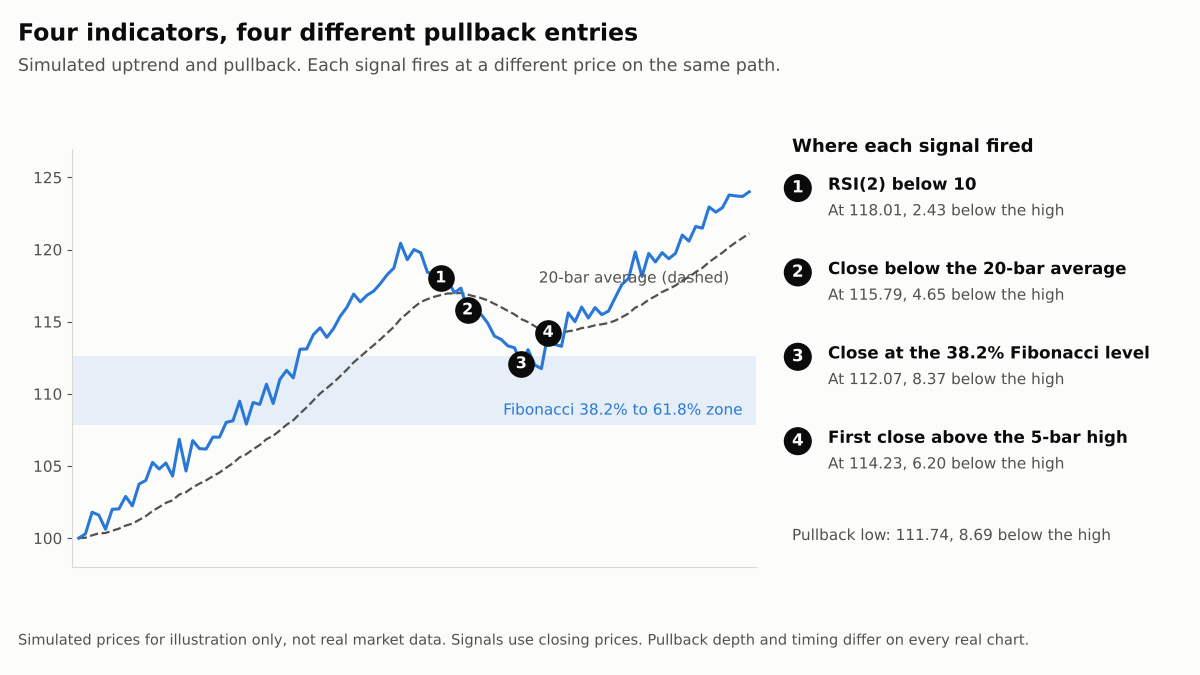
A fast signal like RSI(2) fired only 2.43 below the high. The Fibonacci signal fired 8.37 below it, close to the eventual low of 111.74.
None of them is wrong. They simply trade off how early you get in against how much further the dip can run.
What Testing Has Found
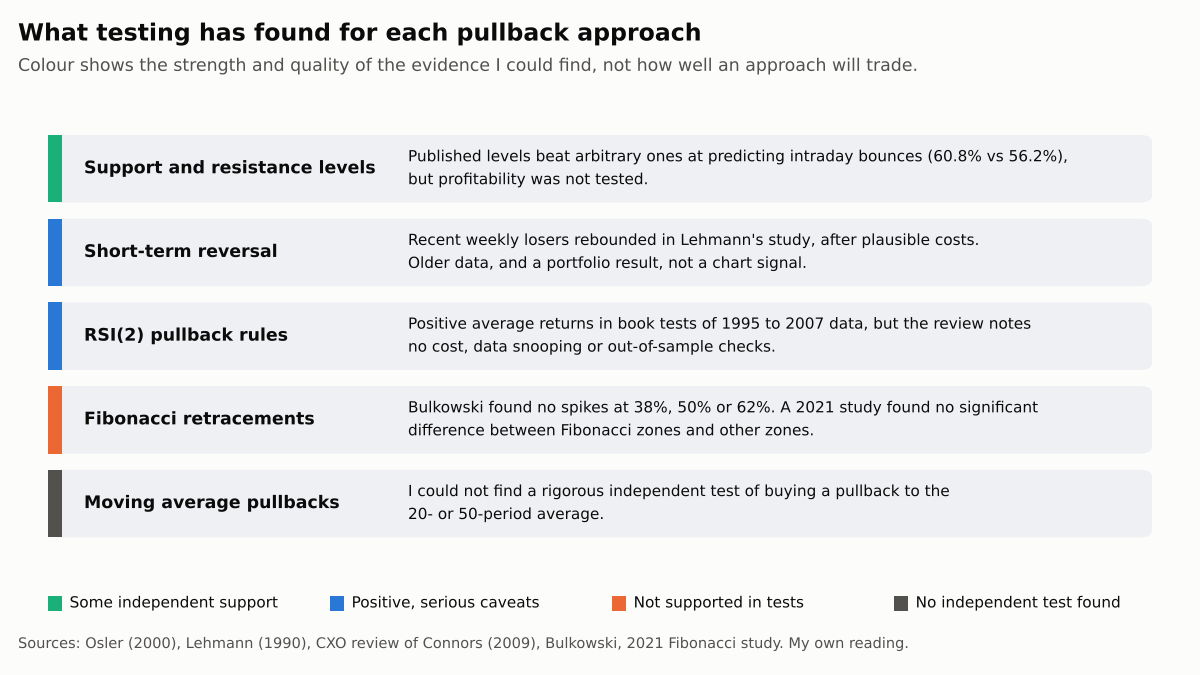
I searched for independent tests of each approach. The picture is uneven, and for some approaches I found nothing rigorous.
Price Levels Have the Best Case
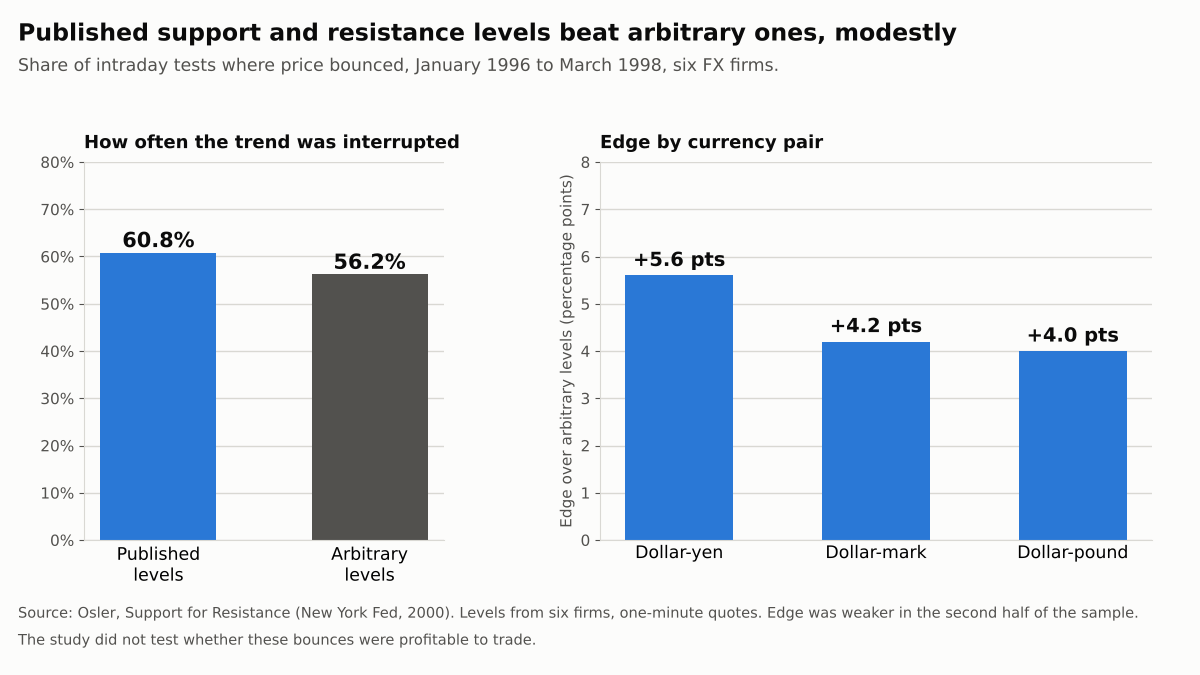
Carol Osler tested support and resistance levels published by six FX firms. In her New York Fed study, price bounced at published levels 60.8% of the time, against 56.2% at arbitrary levels.
That is a modest edge. It was weaker in the second half of the sample, and the study did not test whether the bounces were profitable.
Oversold Indicators and RSI(2)
There is a real market effect behind these. Bruce Lehmann found that stocks that fell in one week tended to rebound the next. His 1990 paper, Fads, Martingales, and Market Efficiency, says the profits persisted after plausible transaction costs.
That is a portfolio result on older data, not an RSI signal. For RSI(2) itself, a CXO Advisory review of Larry Connors’ tests noted positive average returns from 1995 to 2007. It also noted the analysis excluded costs and apparently ignored data snooping and out-of-sample testing.
Fibonacci Levels Look Weakest
Thomas Bulkowski’s frequency distribution of ten years of stock data found no spikes at 38%, 50% or 62% retracements.
A 2021 study tested Fibonacci retracements in three equity markets. Zones around Fibonacci levels were linked to bounces, but behaved no differently from non-Fibonacci zones.
Moving Averages
This is the most popular choice, and I could not find a rigorous independent test of buying a pullback to the 20- or 50-period average. That does not mean it fails. It means the claims are unproven.
Same Rules, Different Pullbacks
Whichever signal you pick, the pullback you get decides the result. Here the same four signals run on a deep pullback and a shallow one. Each uses a stop 3.00 below entry and a target at the prior high.
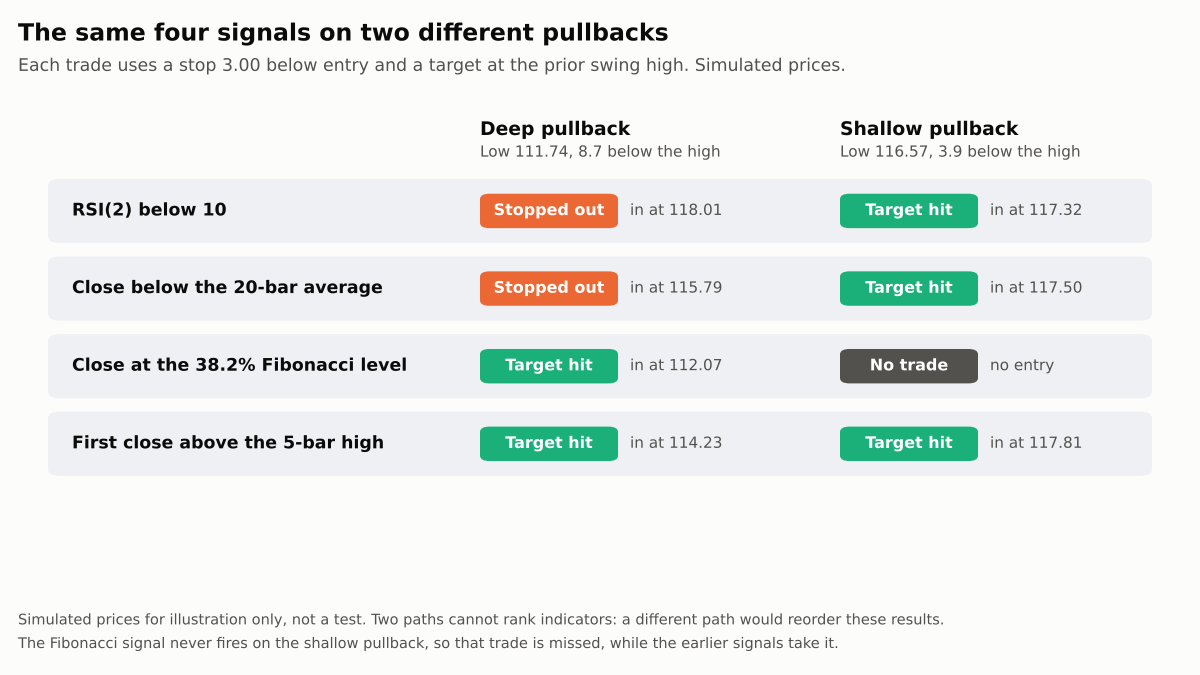
On the deep pullback, the early signals were stopped out. On the shallow one, they won and the Fibonacci signal never fired, so that trade was missed.
Neither result proves anything. A different path would reorder them. The lesson is that the indicator mostly decides how much of the dip you accept.
A Worked Example
Take the deep pullback, a 3.00 stop and a target at the 120.43 high. Entering on RSI(2) at 118.01 offers 2.43 of reward for 3.00 of risk, a ratio of 0.8 to 1.
That trade would need to win about 55% of the time just to break even, before costs. Entering at 112.07 offers 8.37 for 3.00, about 2.8 to 1, which needs only about 26%.
The deeper entry looks better on paper, but it only exists when the dip goes that deep. Our guide to risk-reward ratio and win rate explains the trade-off.
How to Choose and Test
- Decide what the indicator is for. Is it finding the trend, the level, or the timing? Pick the simplest tool that answers that.
- Count the trades you miss. Include shallow pullbacks that never reach your signal, not just the ones it caught.
- Use realistic costs and a held-out period, as in our backtesting guide, and avoid tuning settings until the results look good, which is how overfitting starts.
- Anchor to a price level. Our guide to finding strong support and resistance and the bullish pin bar at resistance show how to test an entry at a level.
Key Takeaways
No indicator has been shown to be the best for pullback entries, and the choice mostly sets how early you accept risk.
Price levels have the best independent support, Fibonacci levels the weakest, and moving average pullbacks are untested. Pick one signal in advance, count the trades it misses, and test it on your own market before relying on it.
This article is for educational purposes and does not constitute financial advice. The worked example uses simulated, hypothetical figures. Trading stocks and forex carries a high level of risk, including the potential loss of the full amount invested, and may not be suitable for all investors.
Leave a Reply