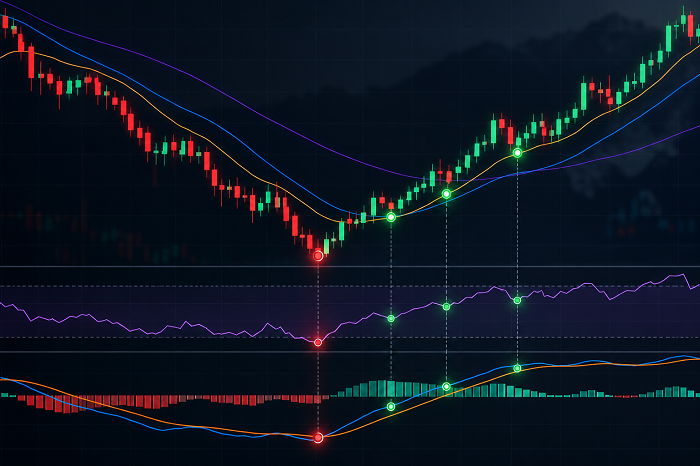
Calling the exact bottom or top of a trend is hard, so many traders wait for a confirmation signal before acting on a possible reversal. Indicators like RSI, MACD and moving averages are the usual choices.
The idea is simple: fewer false alarms in return for a later entry. This article looks at what that trade costs, what tests of these indicators have found, and how to use them without fooling yourself.
What Are Reversal Confirmation Indicators?
They are tools you check after a possible turn to see whether the trend has really changed. The common ones are momentum oscillators such as RSI and MACD, moving average crossovers, and a break of the last swing high or low.
Volume is sometimes added. Most of these indicators are calculated from past prices, so they report a turn after it has begun, not before.
The Trade-Off: Confirmation Arrives Late
The chart below uses a simulated price path with a known low. It shows when four common confirmations fire on that one path.
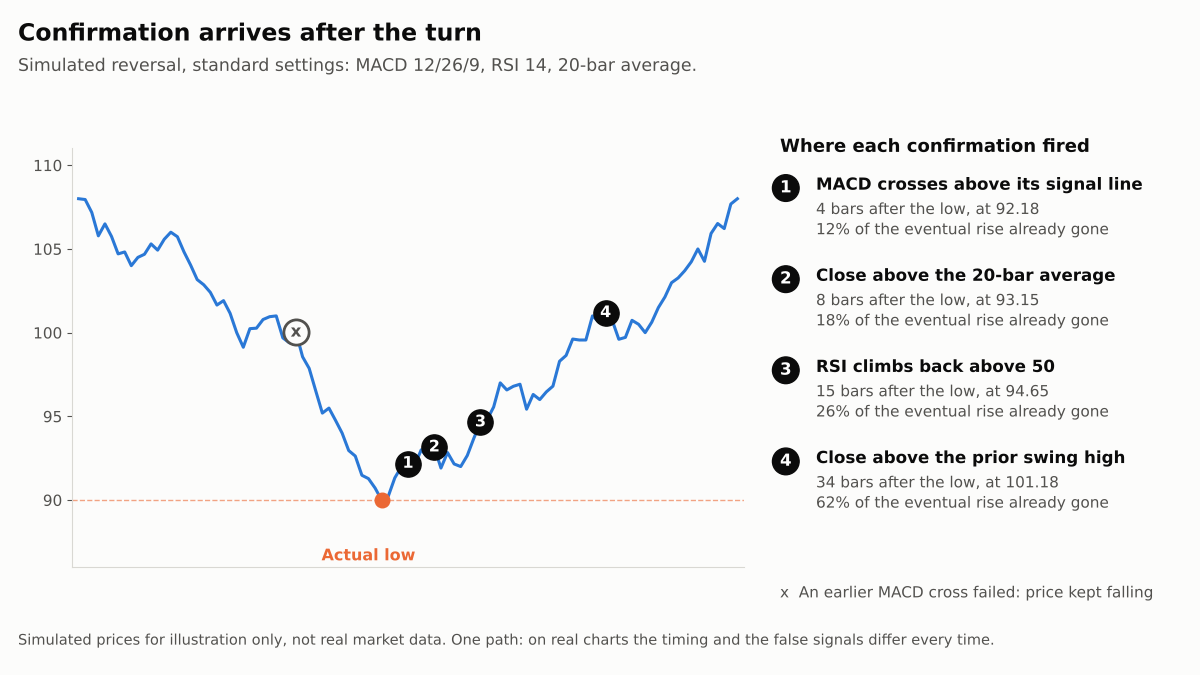
The fastest signal, a MACD cross, came four bars after the low, with about 12% of the eventual rise already gone. The slowest, a close above the prior swing high, came 34 bars later, after about 62% of the rise.
The fast signal also had a failed twin. An earlier MACD cross fired during the decline, and price kept falling. This is one simulated path, but it shows the general trade-off: faster signals fire more false alarms, and slower ones miss more of the move.
Do These Indicators Work in Tests?
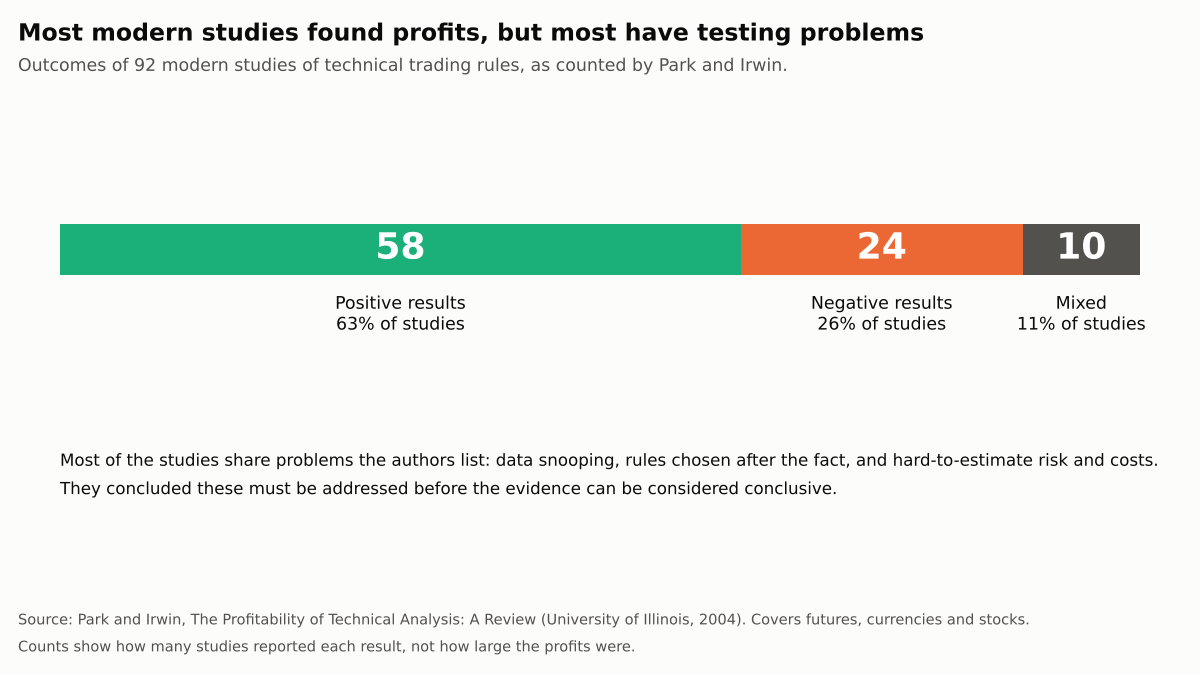
The evidence is mixed. Park and Irwin reviewed 92 modern studies of technical trading rules. Of these, 58 reported positive results, 24 negative and 10 mixed.
The authors added that most studies suffer from data snooping, rules picked after the fact, and difficulty estimating costs. They said these problems must be addressed before the evidence is conclusive.
MACD and RSI in Particular
Chong and Ng tested both on 60 years of London’s FT30 index. They found MACD and RSI rules generated returns higher than buy-and-hold in most cases.
A follow-up by Chong, Ng and Liew looked at five more stock indexes from 1976 to 2002. Results were mixed and the authors said the rules were not robust to the choice of market.
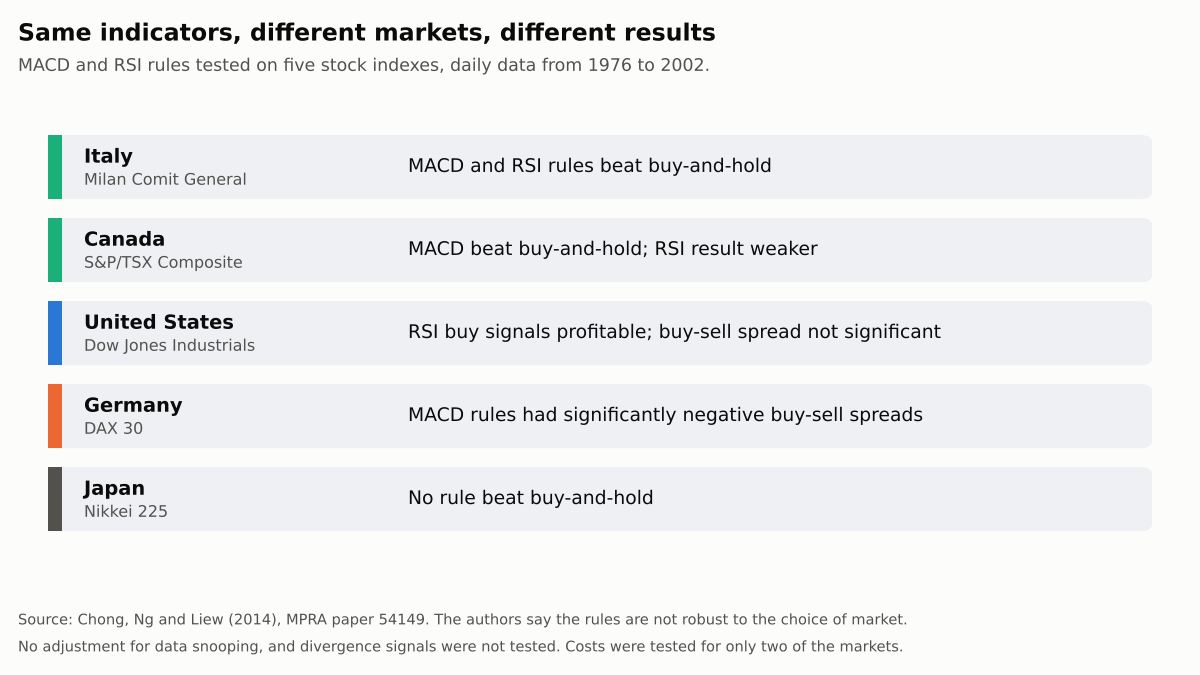
Two details matter. The tests used crossovers and zone exits, not divergence. And the authors report that RSI crossing its centerline did better than the classic overbought and oversold rules.
Edges Can Fade
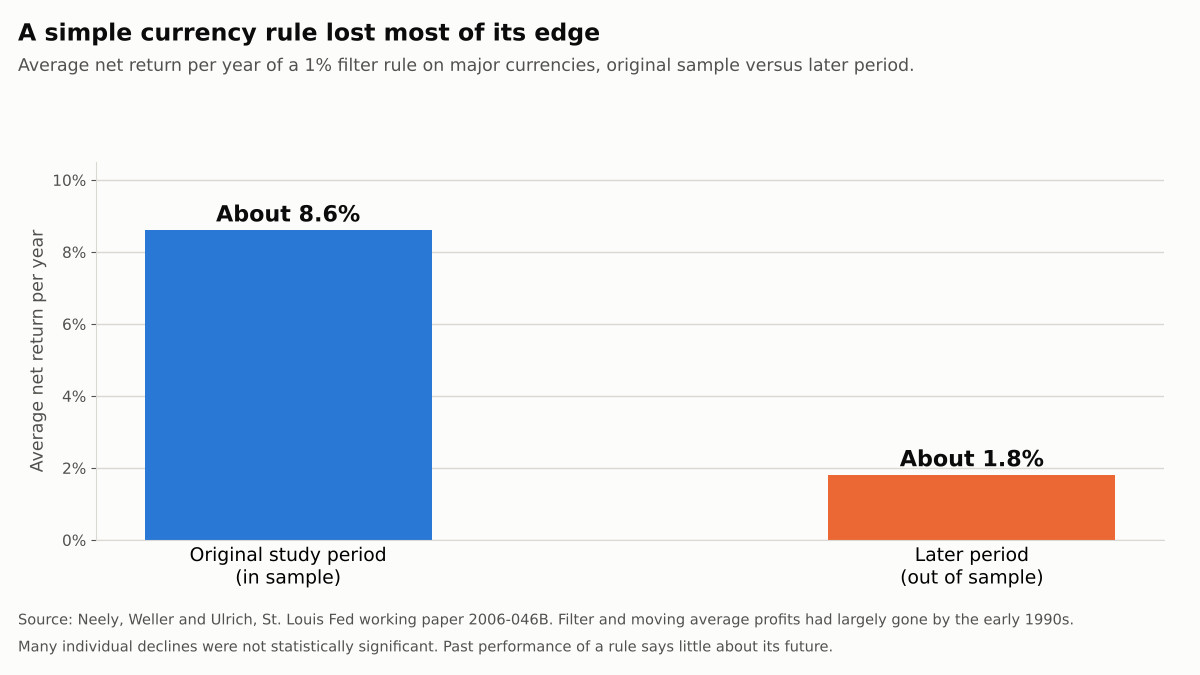
Neely, Weller and Ulrich tested published rules on currencies after the original study periods. They found that filter and moving average profits had largely disappeared by the early 1990s.
One 1% filter rule’s average net return fell from about 8.6% a year to about 1.8%. The authors noted that many individual declines were not statistically significant.
I could not find a rigorous independent test of RSI divergence, the most popular reversal signal. Treat it as unproven.
A Worked Example
Use the simulated path above, with a low of 90.00. You risk $300 and put the stop at 89.50, just under the low.
Entering on the MACD cross at 92.18 risks 2.68 per share, so the position is 111 shares. Entering on the swing-high break at 101.18 risks 11.68 per share, so it is only 25 shares.
If price then ran to 108, the early entry would have earned about 5.9 times its risk and the late one about 0.6 times.
That is hindsight, and the early signal was also the one with a failed twin. Our guide to risk-reward ratio and win rate covers the trade-off.
How to Use Confirmation Sensibly
- Choose what you are confirming. Decide in advance which signal counts, and write it down.
- Use one or two signals, not five. RSI, MACD and moving averages all come from past prices, so stacking them adds less than it seems.
- Size for the later entry. A confirmed entry usually has a wider stop, so the position must be smaller.
- Test on your own market. Use realistic costs and a held-out period, as in our backtesting guide, and avoid tuning settings until the results look good, which is how overfitting starts.
- Combine with price levels. Our guides to finding strong support and resistance and the bullish pin bar at resistance show how to test a reversal at a specific level.
Key Takeaways
Confirmation indicators trade speed for certainty, and the tests do not show they reliably pay for that delay.
Studies are mixed, depend on the market, and often show edges fading over time. Pick your signal in advance, size for the later entry, and test it on your own market before relying on it.
This article is for educational purposes and does not constitute financial advice. The worked example uses simulated, hypothetical figures. Trading stocks and forex carries a high level of risk, including the potential loss of the full amount invested, and may not be suitable for all investors.