
Many traders learn a simple rule early on. When the dollar falls, gold rises. When the dollar rises, gold falls.
The rule is useful, but it is a tendency, not a law. This article explains why the link exists, how strong it has been, and when it has broken down.
Why Gold and the Dollar Are Linked
Gold is priced in US dollars and pays no interest. City Index notes that this is why it often has an inverse relationship with the dollar and with real yields.
There are two usual explanations. A weaker dollar makes gold cheaper for buyers using other currencies. And lower real yields reduce the cost of holding an asset that pays nothing.
Both are plausible. Neither guarantees that the two prices move in opposite directions every week.
What Correlation Actually Measures
Correlation runs from -1 to +1. A reading of -1 means two prices always move in opposite directions. Zero means no consistent link.
A reading of -0.41 sounds strong, but it is modest. Squaring it gives about 0.17, so the dollar would account for roughly a sixth of the ups and downs in gold. At -0.50, it is a quarter.
That is a rough guide, not a precise one. It does show why a correct view on the dollar can still leave you wrong on gold.
What Recent Readings Show
An analyst piece on FXStreet reports that over five years the mean 60-day correlation between gold and the dollar index was -0.41, with almost 95% of windows negative. The latest reading was -0.50.
The same piece says both the 20-day and 60-day readings briefly turned positive in 2023. It describes gold as still an effective hedge against dollar strength, though other drivers may take over at times.
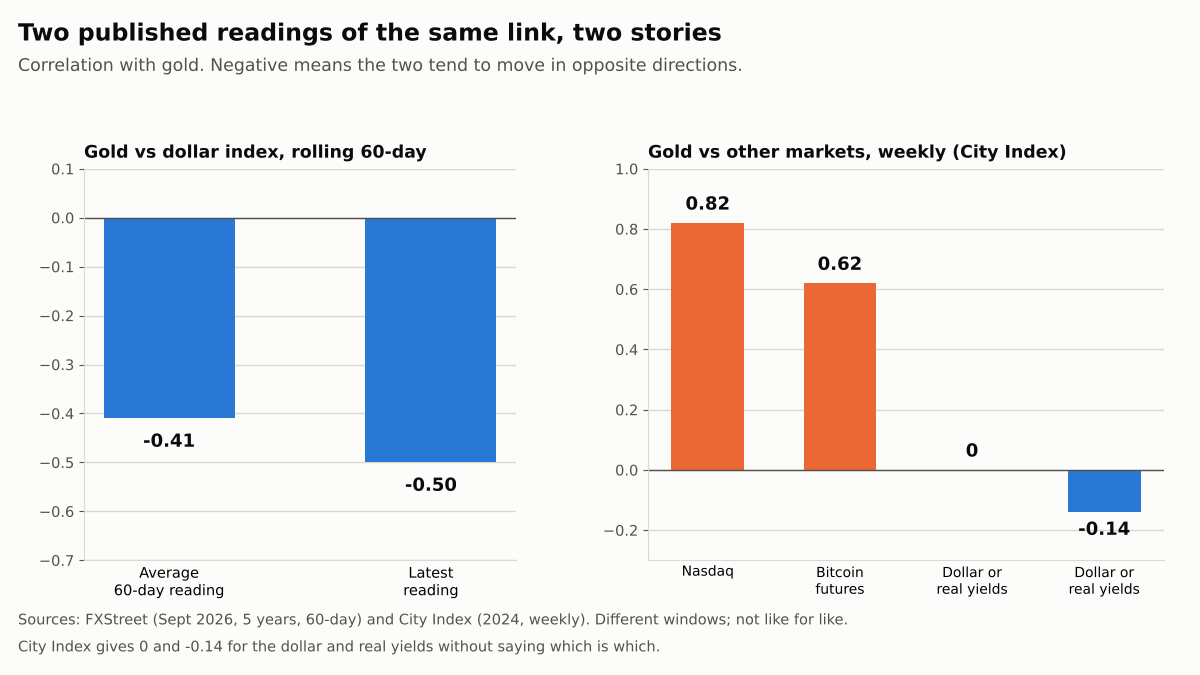
City Index told a different story for 2024. It reported weekly correlations of 0 and -0.14 for the dollar and real yields, against 0.82 with the Nasdaq and 0.62 with bitcoin futures.
Neither source publishes its method in full, and the windows differ. The fair reading is that the link is usually negative, but its strength moves a lot.
When the Link Has Bent
The best-known exceptions are periods of stress. The dollar is also a safe haven, so in a crisis both can rise together.
A report in The National points to the financial crisis, when the dollar index rose 21% between July 2008 and March 2009, and to early 2020, when gold and the dollar both rose.
One analyst it quotes says a sharp rise in geopolitical risk can boost gold and the dollar at the same time. The article’s headline is stronger than its body, which also says the negative link is not a myth.
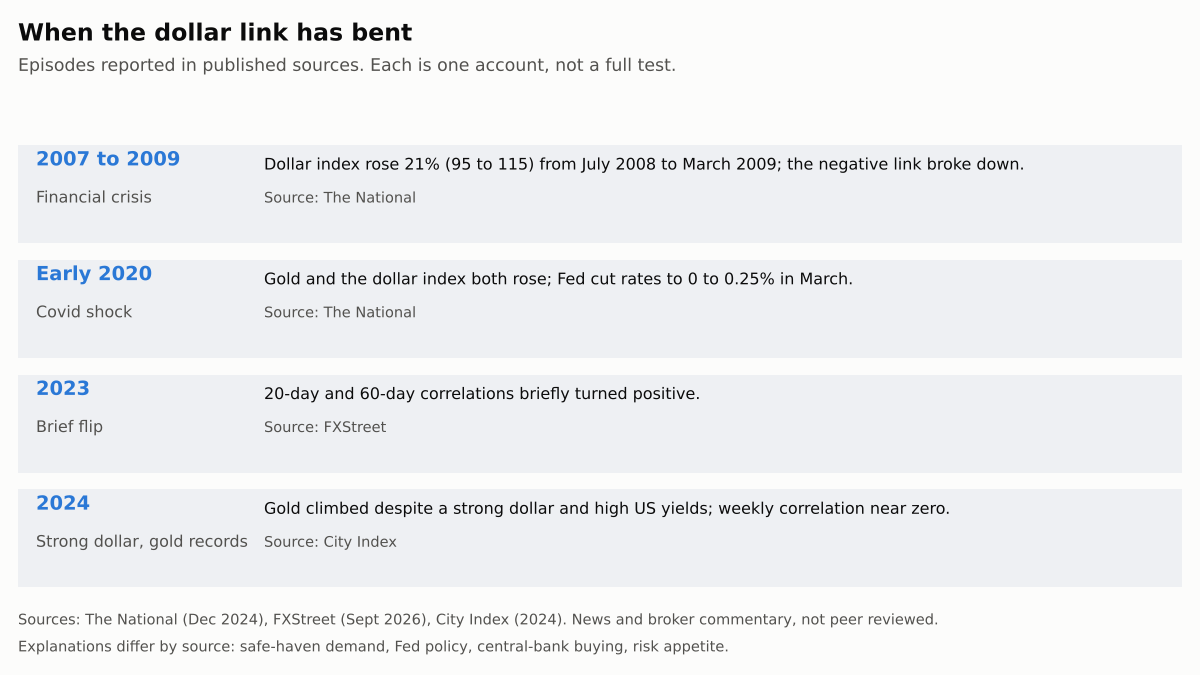
In 2024, City Index said gold rose to records despite a strong dollar and high yields. It described gold as behaving less like a safe haven and more like a long-duration risk asset.
What Academic Work Adds
Academic papers are less direct than the headlines suggest.
Dirk Baur and Brian Lucey studied gold against US, UK and German stocks and bonds. They found gold is a hedge against stocks on average and a safe haven in extreme conditions, but that the safe-haven effect is short-lived.
That is about stocks and bonds, not the dollar. I could not read the sample period from the abstract.
Claude B. Erb and Campbell Harvey examined gold as an inflation hedge. They concluded that over practical horizons gold is an unreliable inflation hedge. The abstract does not discuss the dollar or real yields.
A well-cited 2005 paper by Capie, Mills and Wood is titled Gold as a hedge against the dollar. The record I could access has no abstract, so I do not quote its findings here.
Treat broker explainers with care too. One broker article claims the correlation fell from 84% to just 3%, but names no data source and gives a different historical range elsewhere in the same piece.
How the Link Can Flip
The chart below uses a simulated path. It has three phases. The dollar falls and gold rises. Then stress lifts both. Then the dollar rises and gold falls.
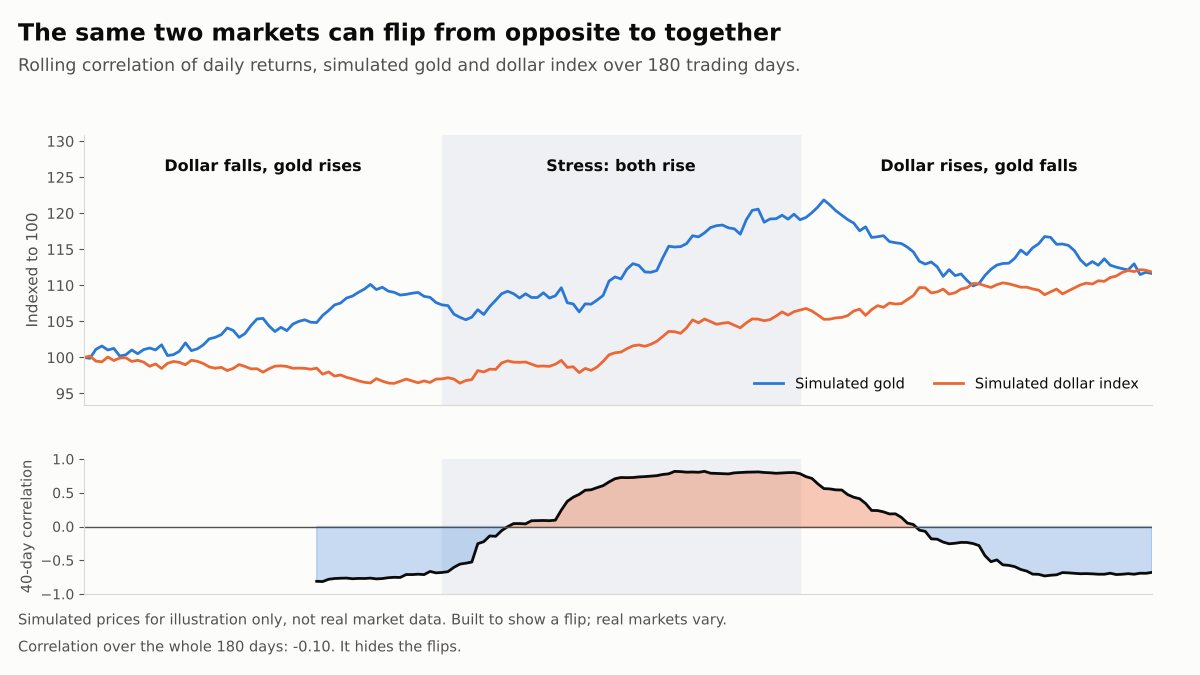
The correlation over all 180 days is only -0.10. It hides the flips. A rolling window shows them, but it lags, so it confirms a change after it has started.
A Worked Example
Use the simulated chart. In the stress phase the dollar index climbs to 3% above its low, so a trader shorts gold at 4,849 on the rule “dollar up, gold down”.
The stop is 2% higher, at 4,946, which risks 97 per ounce. With $200 at risk, the position is about 2.1 ounces.
Four days later the stop is hit, for a loss of $200. Gold then kept rising to 5,256 by the end of the phase. The dollar signal was real, but gold was following the stress, not the dollar.
That phase was built to behave this way, so it shows the mechanics, not the odds.
Costs would make the loss slightly larger. Our guide to risk-reward ratio and win rate shows how to size trades when a signal is only a tendency.
How to Use the Link Without Over-Trusting It
- Check the window. A 20-day and a 60-day correlation can disagree. Look at both before relying on either.
- Treat it as a filter, not a trigger. A weak dollar can support a gold setup, but price at a level should still decide the entry.
- Watch for stress. If both are rising, the usual rule is probably off. Do not trade the old relationship on autopilot.
- Look at real yields too. The dollar is one driver among several, along with inflation expectations, geopolitical risk and central-bank demand.
- Test it on your own data, with your own broker’s costs and a held-out period, as in our backtesting guide. Avoid tuning the window until it fits, which is how overfitting starts.
- Plan for the bad run. A relationship that fails for a few weeks can cause a long losing streak, so size positions using our guide to acceptable drawdown.
Key Takeaways
Gold and the dollar have usually moved in opposite directions, but the link is moderate and it changes with conditions.
Published readings range from about -0.5 to roughly zero depending on the window, and crises can push both higher together. Use the dollar as one input, check the recent correlation, and test any rule on your own data before risking money.
This article is for educational purposes and does not constitute financial advice. The worked example uses simulated, hypothetical figures. Trading stocks and forex carries a high level of risk, including the potential loss of the full amount invested, and may not be suitable for all investors.
Leave a Reply