
A strong track record is the most persuasive thing a trader, signal seller or robot vendor can show. It is also the easiest thing to flatter.
You do not need special software to check one. This article walks through what to look at, which tricks to watch for, and how long a record needs to be before it means anything.
Our guide to warning signs in signal providers covers the sales pitch. This one covers the numbers behind it.
What a Track Record Can Show
Even a perfect record only shows what happened. It does not show that the same results will come back.
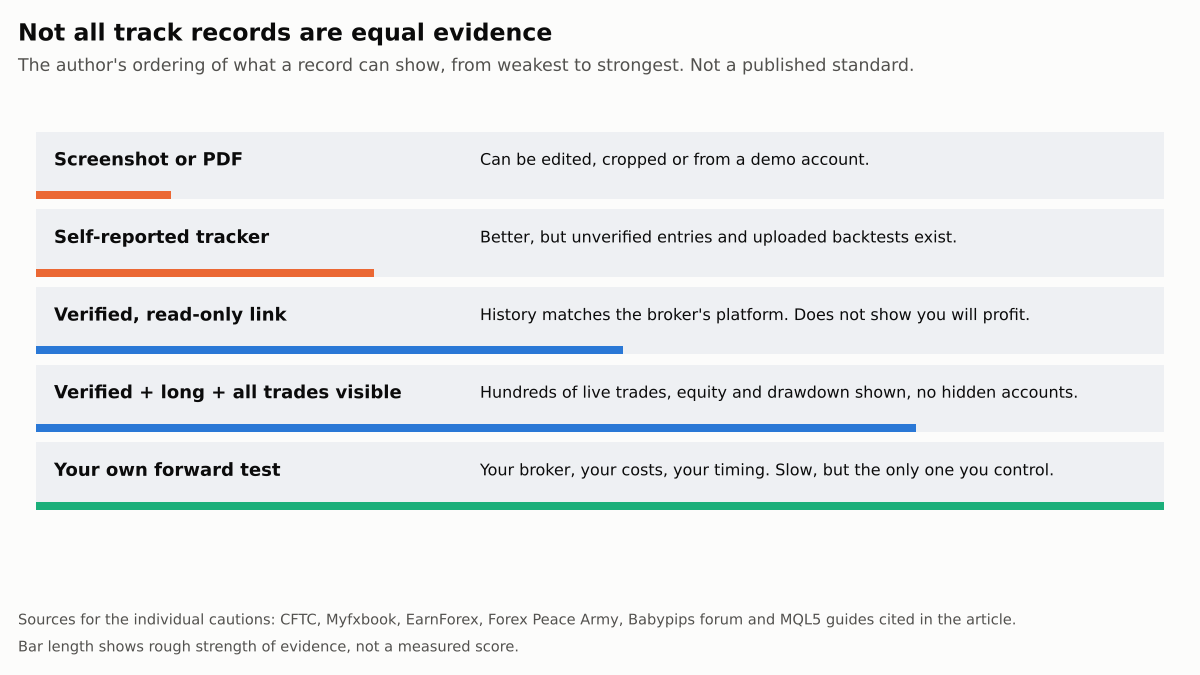
Some records are better evidence than others. A screenshot is the weakest. A verified, read-only link to a live account is stronger. Your own forward test is the only one you fully control.
Step 1: Check It Is Real and Live
Third-party trackers such as Myfxbook connect to an account with a read-only investor password. Myfxbook’s own early post says that password lets it view trading activity but not trade.
A Babypips forum guide explains the two green ticks. Track record verified means the data matches the broker’s server. Trading privileges verified means the person showing it can place trades.
Neither tick says the strategy is good. The author of one Myfxbook-reading guide stresses that these labels do not certify that a strategy is suitable for you. That author also promotes their own products.
Step 2: Look for Tricks in the Header
A forum thread on recognising fake Myfxbook accounts lists several signs. They include a server shown as “Other (MT4)”, a custom start date, a short history, and an uploaded backtest passed off as live results.
A Forex Peace Army article adds screenshots with no live link, lookalike domains, and hidden balance or history. It also says a demo account could be relabelled as real.
Both sources date from 2019, and both have commercial links: the thread includes sellers, and Forex Peace Army runs its own testing service. The author also says a bug might have been fixed since. Treat them as a list of things to look for, not proof of how a tracker works today.
Step 3: Read the Gain Carefully
A percentage gain can mislead when money moves in and out. The EarnForex thread describes gain inflated by a tiny initial deposit followed by larger deposits.
The chart below shows how this can work. A $200 account grows 50%, receives a $4,700 top-up, then loses money. The compounded return is positive, but the trader has lost $300.
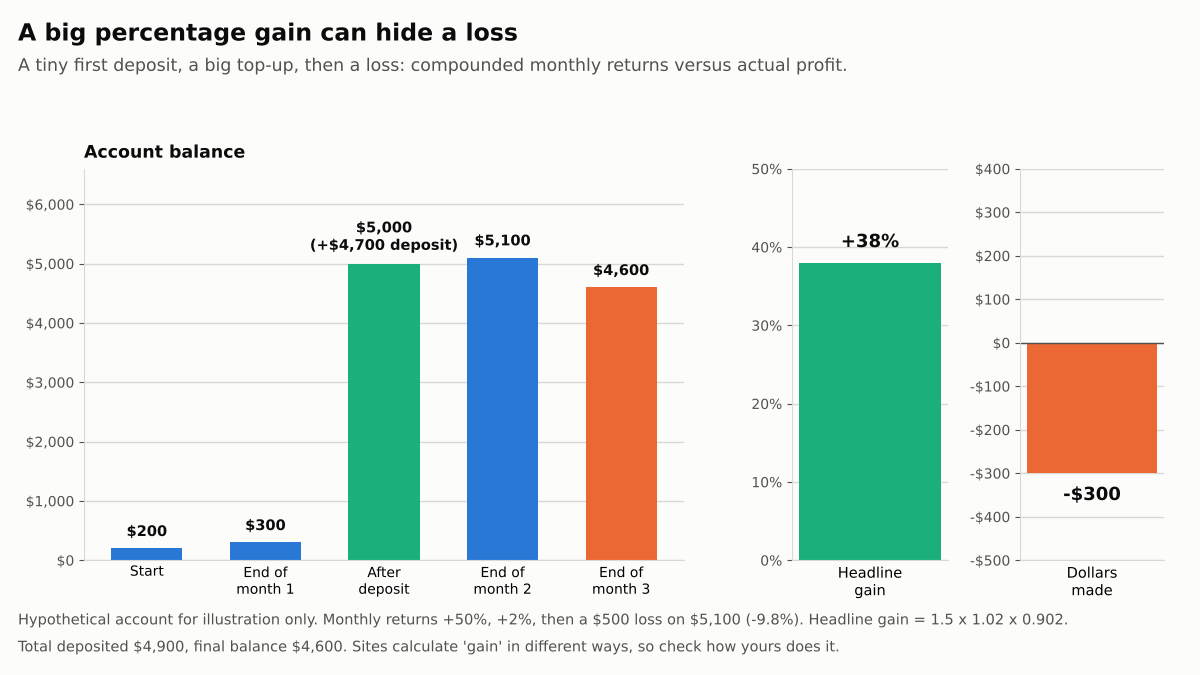
The fix is simple. Ask for deposits and withdrawals, and compare the percentage with the dollars actually made.
Step 4: Compare Equity with Balance
Balance counts only closed trades. Equity includes open ones. A guide to reading Myfxbook records warns that a balance-only view could hide exposure.
Its example is hypothetical: a $10,000 balance with $8,500 equity means $1,500 is tied up in open losses. Forex Peace Army describes an account whose equity showed 69% while open trades were down 31%.
Check the drawdown too. It depends on the data the service observed, so a quiet-looking curve can understate the worst moment.
Step 5: Count Trades and Months
Short records are mostly noise. Bailey and López de Prado’s paper on the Sharpe ratio efficient frontier introduces a minimum track record length, which says how long a record must be to be statistically confident.
The R package that implements it lists the inputs: the Sharpe ratio, skewness, kurtosis, and confidence level. Fatter tails and higher confidence need a longer record.
A 2021 paper testing simple FX strategies shows how wide the range can be. In a three-year window, one strategy needed about 0.8 years of data and a MACD strategy about 61 years to show a Sharpe ratio above zero, at 95% confidence.
My own simulation shows the same idea. It uses hypothetical traders with 5% monthly volatility and no memory between months.
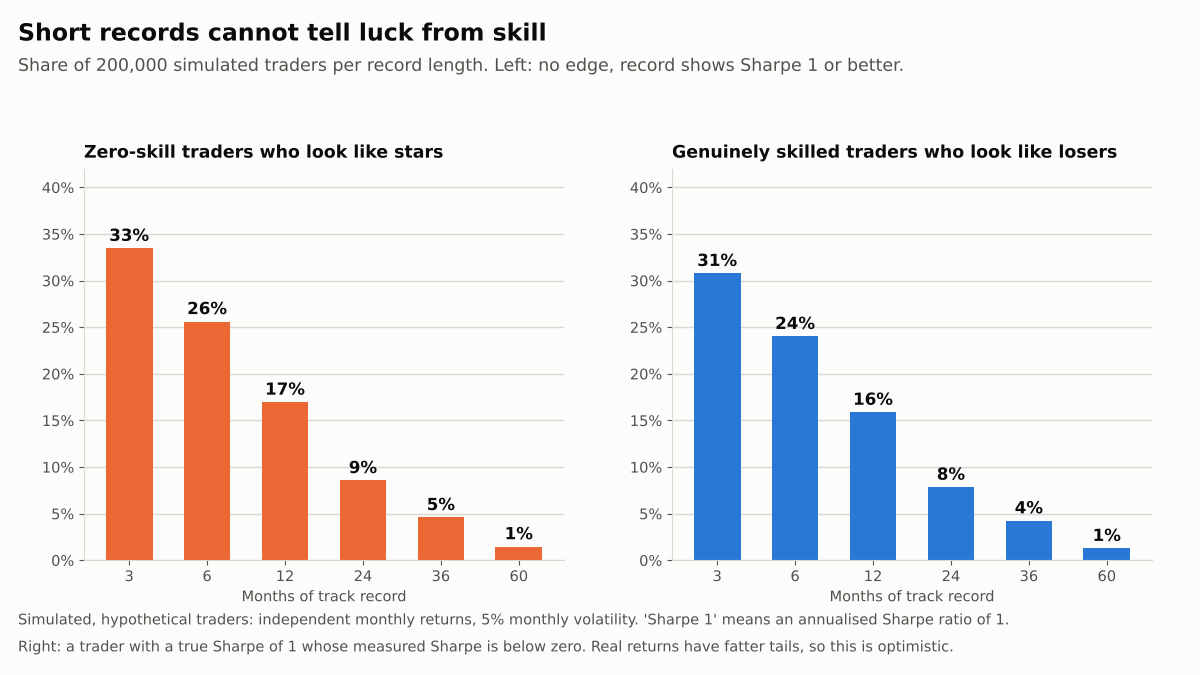
After three months, about one in three traders with no edge looks like a star. After a year it is about one in six, and after five years about one in seventy.
The same noise hides real skill. A trader with a true Sharpe of 1 shows a losing record about 31% of the time after three months.
Another paper by Bailey and López de Prado, on the deflated Sharpe ratio, adds that a seller who tried many versions and reports only the best one gives an over-optimistic picture.
Step 6: Spot Hypothetical Results
A backtest is not a track record. It is built with hindsight and never faced real fills.
In the US, the CFTC’s rule 4.41 says simulated results from commodity trading advisors and pool operators must carry a cautionary statement. It begins: “These results are based on simulated or hypothetical performance results that have certain inherent limitations.”
The rule does not cover every signal seller or robot vendor. Absence of that warning does not mean the results are real.
A Worked Example
Use the hypothetical account above. It starts with $200, gains 50% in month one, receives $4,700, gains 2% in month two, then loses $500 in month three.
Compounding the monthly returns gives 1.5 x 1.02 x 0.902, or about +38%. But total deposits were $4,900 and the final balance is $4,600, so the real result is a $300 loss.
The account above has only three months of history, and the simulation shows a record that short says almost nothing about skill. Our guide to risk-reward ratio and win rate shows what else to ask for.
A Checklist You Can Use
- Open the live page yourself. Type the tracker’s address, and check both verification ticks and the broker name.
- Look at deposits and withdrawals. Compare percentage gain with dollars made.
- Check equity, not just balance. Look at open positions and the maximum drawdown.
- Count months and trades. Treat anything under a year as thin evidence, and even a year is not proof.
- Look for hidden data. Missing history, hidden lot sizes or a custom start date are reasons to walk away.
- Test it yourself. Forward test on a demo or very small account with your own broker’s costs, using our backtesting guide. Do not tune settings until it fits, which is how overfitting starts.
- Plan for the worst stretch. Use our guide to acceptable drawdown to decide when you would stop.
Key Takeaways
A verified tick shows the history is genuine. It does not show the strategy has an edge, and a short record cannot tell luck from skill.
Look at dollars, equity, deposits, trade count and length of history, and treat backtests as hypotheses. Then confirm with a small forward test of your own before real money goes in.
This article is for educational purposes and does not constitute financial advice. The worked example uses simulated, hypothetical figures. Trading stocks and forex carries a high level of risk, including the potential loss of the full amount invested, and may not be suitable for all investors.
Leave a Reply