
Many gold traders focus on the London session. It is when Europe opens, volume builds, and a quiet Asian range can turn into a trend.
This article looks at why London matters for gold, how the common range breakout works, and what the available tests suggest about it.
Why London Matters for Gold
London is the home of the gold benchmark. The LBMA Gold Price is set in US dollars twice a day, at 10:30 and 15:00 UK time, and replaced the older London Gold Fix in March 2015.
Research on intraday gold data points to the same hours. Batten and co-authors studied 5-minute precious metals data from 2000 to 2015.
They found the highest number of gold trades from about 11:00 to 17:00 GMT, when both European and North American markets are open. Gold volatility was fairly flat until 12:00 GMT and then rose slightly until 14:00.
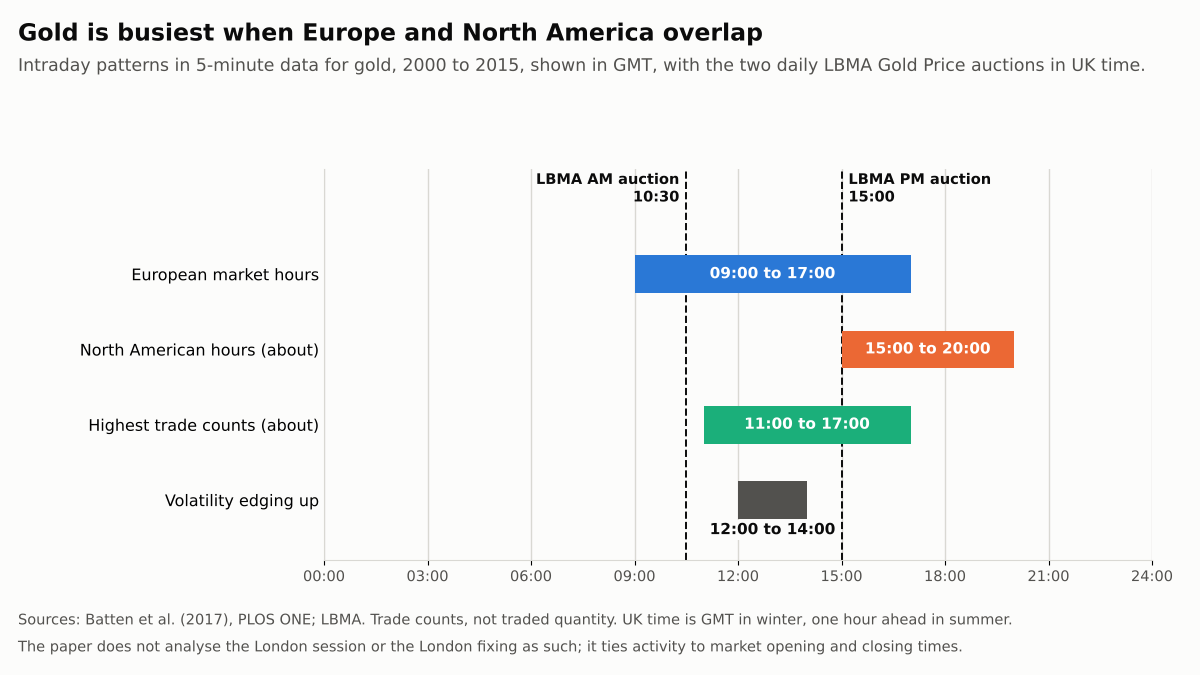
Note that this is a busy-hours finding, not a profit finding. A busy market is not automatically a profitable one.
The Standard Setup
The most common London strategy is an Asian range breakout. Mark the high and low of the quiet overnight hours, then trade a break of either side after London opens.
The stop usually goes at the other side of the range. The target is a multiple of that risk, often 2 to 1.
The chart below applies one rule to two simulated days. The rule is the same. The outcomes are opposite.
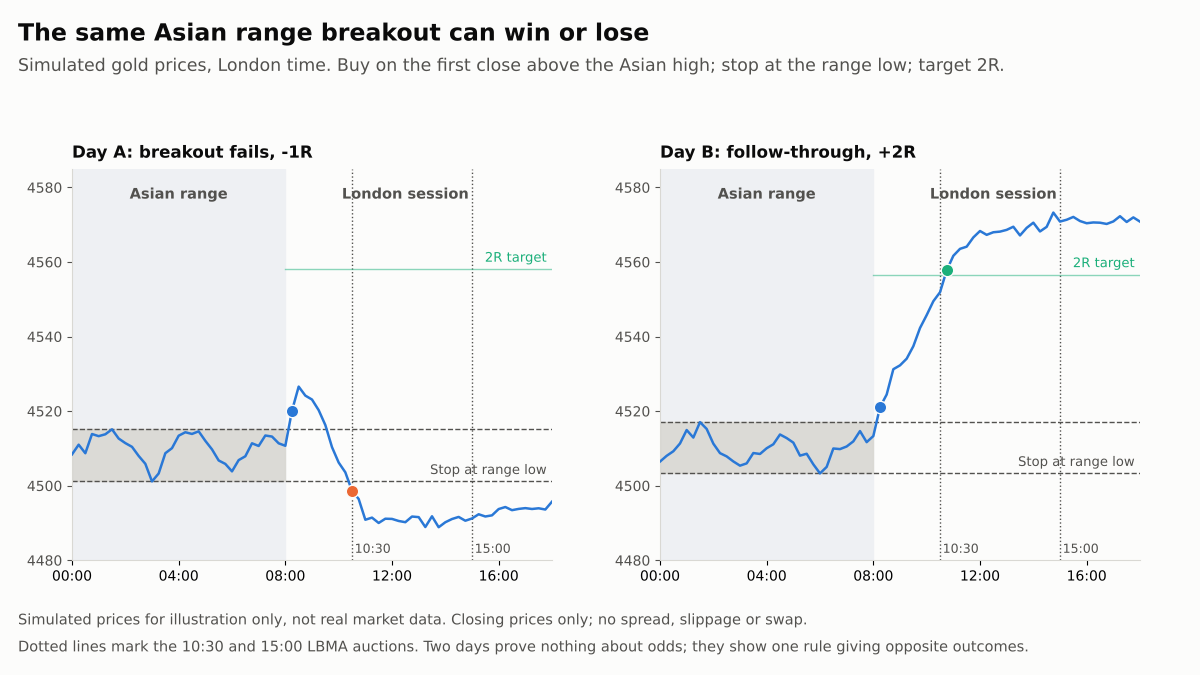
On Day A, price broke out, reversed, and fell through the range low. On Day B, it ran straight to the target. Nothing on the chart before the break told you which day it would be.
What Backtests Show
Public tests give conflicting answers. One MQL5 blog post on a gold London breakout reports a profit factor of 1.38 over 715 trades from 2023 to 2026, with a 17.3% drawdown.
Its author sells a trading robot, and the post does not mention spread, commission or slippage. The settings were also chosen on part of the same data. A small 2026 holdout of 157 trades did better, but the author calls it a small sample.
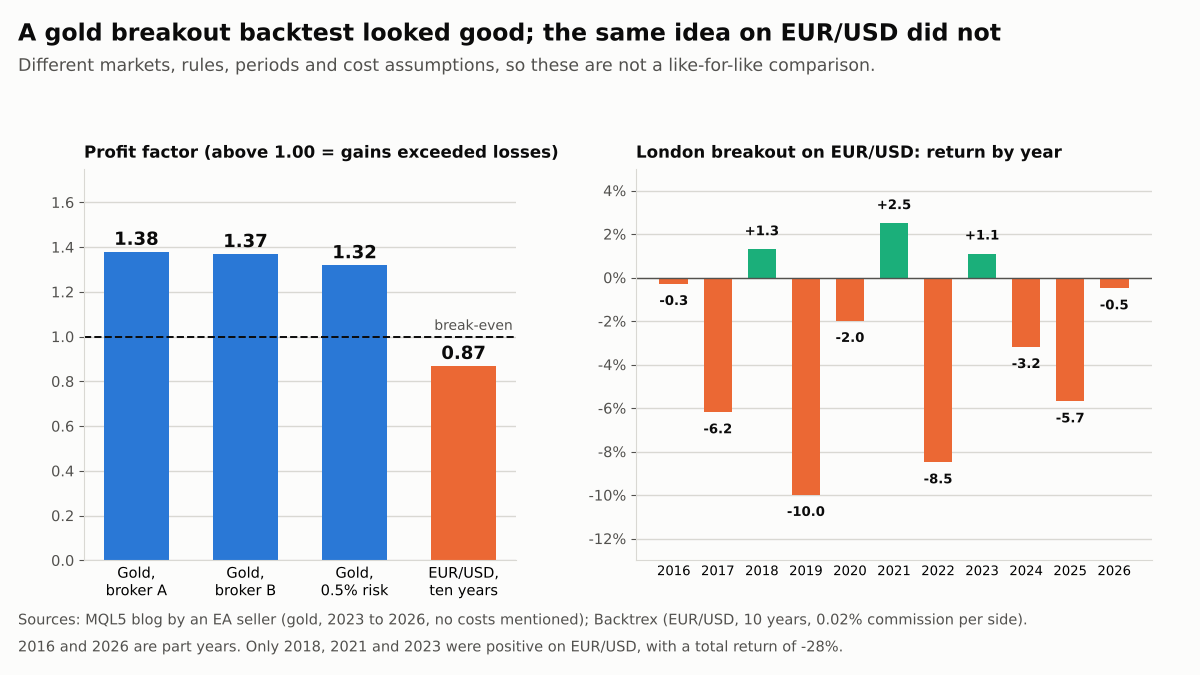
The same idea on a different market fared worse. A Backtrex test of a London breakout on EUR/USD covered ten years and 1,230 trades.
It won 36% of the time, had a profit factor of 0.87 and lost 28% in total. Only three of eleven calendar years were positive. Backtrex is a backtesting app vendor, and it counted commission but not spread.
Why Gold Backtests Can Flatter
Gold has been in an uptrend through much of that window. One MQL5 article on real-tick gold testing argues that this makes buy-side logic look better than it is, and that spreads vary several-fold between brokers.
It also warns that an edge needing one specific hour is fragile. That author also sells gold robots and gives no data, so treat it as a caution, not a finding.
A survey adds colour, not proof. A broker-affiliated survey of 1,050 retail traders found that 47% reported their largest losses in the Asian session and 62% their best results in the London and New York overlap. That is perception, not measured performance.
What About Efficiency?
A study of gold futures over 128 trading days found price efficiency fell at the London open, and that informed trading dominated the New York day session.
That could mean early London prices are noisier. It is a short sample of futures, not spot gold, so it supports caution, not a rule.
A Worked Example
Use the simulated chart. On Day A, buying at 4,520.1 with a stop at the range low of 4,501.1 risks 19.0 per ounce. With $100 at risk, that is about 5.3 ounces, and the stop loses $100.
On Day B, the entry was 4,521.1 and the stop 4,503.3, risking 17.8. About 5.6 ounces reached the target of 4,556.6, for $200.
Net, that is $100 over two trades. A 2 to 1 target needs a win rate of about one in three to break even, before costs. Our guide to risk-reward ratio and win rate explains the trade-off.
How to Cut the False Signals
- Fix the clock. UK time shifts with daylight saving, and brokers use their own server time. Check your range hours once, and again when clocks change.
- Filter the range. The MQL5 author skipped days when the range was under 0.30% or over 1.60% of price. Narrow ranges breed false breakouts; wide ones mean the move already happened.
- Use the full range for the stop. The same author found stops in the middle of the range were hit by normal noise too often.
- Test every day, not just the winners, with your own broker’s spreads and a held-out period, as in our backtesting guide. Avoid tuning the hours until it looks good, which is how overfitting starts.
- Expect false breakouts. Our guides to the inside bar false breakout and finding strong support and resistance show how to judge a break at a level. Plan for losing streaks too, using our guide to acceptable drawdown.
Key Takeaways
London is a busy and benchmark-setting window for gold, but busy hours are not a proven edge, and public breakout tests disagree.
The favourable gold test came from a robot seller without costs, and the same idea lost money on EUR/USD. Treat any London rule as a hypothesis, and test it on your own broker’s data before risking money.
This article is for educational purposes and does not constitute financial advice. The worked example uses simulated, hypothetical figures. Trading stocks and forex carries a high level of risk, including the potential loss of the full amount invested, and may not be suitable for all investors.
Leave a Reply