
Volume divergence looks like a free early warning. Price pushes to a new high, but volume does not follow, and the move seems to be running on empty.
The idea is old and popular. This article looks at how it works, what has actually been tested, and why the evidence for the divergence signal itself is thinner than the theory.
What Volume Divergence Is
Most traders measure it with on-balance volume (OBV). Joe Granville introduced it in 1963, and it is a running total of positive and negative volume.
On an up close, the day’s volume is added. On a down close, it is subtracted. A bearish divergence forms when price makes a higher high but OBV makes a lower high. A bullish one is the mirror image.
The logic is that “volume precedes price”. Fewer buyers on each new push suggests that a rally is tiring.
What a Divergence Looks Like
The chart below uses a simulated uptrend. Volume was built to dry up on rallies and swell on pullbacks, so OBV drifts lower while price climbs.
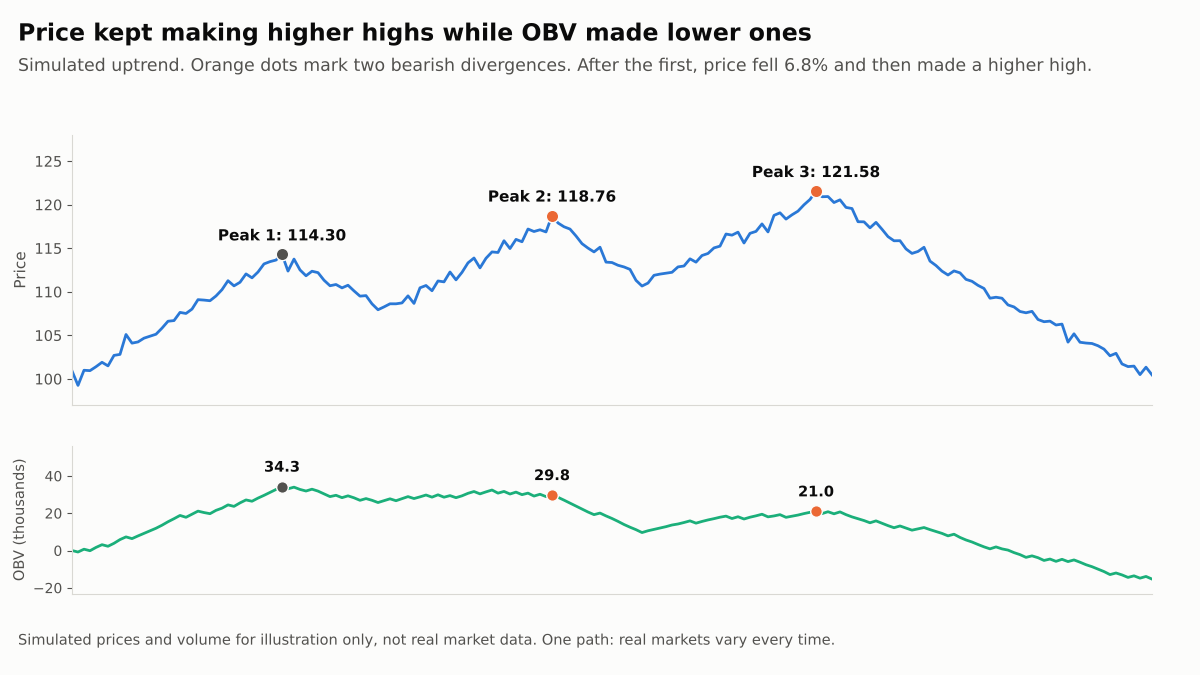
The first divergence came at 118.76. Price then fell 6.8%, but went on to make a higher high at 121.58. The second divergence preceded a fall of 17.4%.
That is one path I built, so it shows the mechanics, not the odds. The point is that a divergence can be early by a long way.
Why OBV Can Mislead
OBV counts the whole day’s volume as buying or selling based only on the close. One heavy day can therefore swamp the rest.
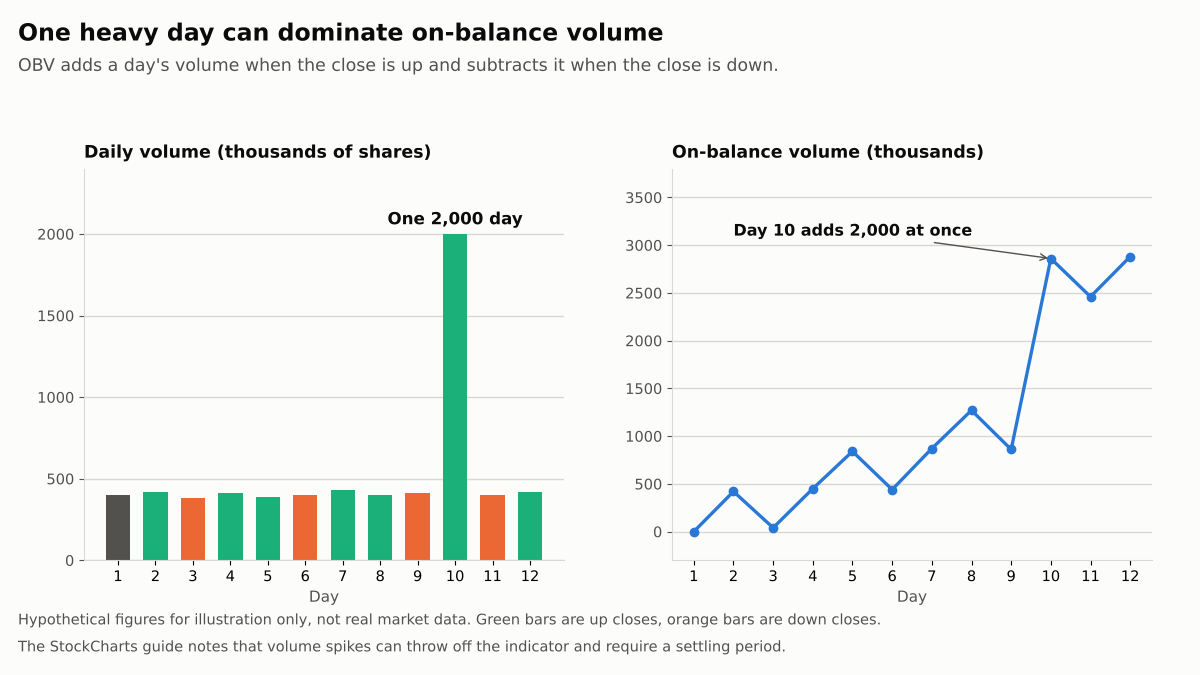
StockCharts notes that volume spikes can throw off the indicator and that it should not be used as a standalone tool.
What Has Been Tested
Several studies support the idea that volume carries information. Blume, Easley and O’Hara built a model in which volume provides information on information quality that cannot be deduced from price.
That is theory, not a test of divergence. Empirical papers go further, but they study volume levels, not divergence between price and volume.
Gervais, Kaniel and Mingelgrin found that stocks with unusually high trading volume tend to appreciate over the following month. Unusually low volume pointed the other way.
Lee and Swaminathan found that past volume predicts both the magnitude and persistence of price momentum. High-volume winners reversed faster than low-volume ones.
One OBV-specific paper exists. Tsang and Chong report that an OBV trading rule was profitable in Greater China stock markets. I could only read the abstract, which gives no sample, costs or divergence rule.
Does High Volume Confirm a Move?
The common belief is that heavy volume makes a breakout more reliable. Thomas Bulkowski tested this on more than 8,000 chart patterns from 1991 to 2011.
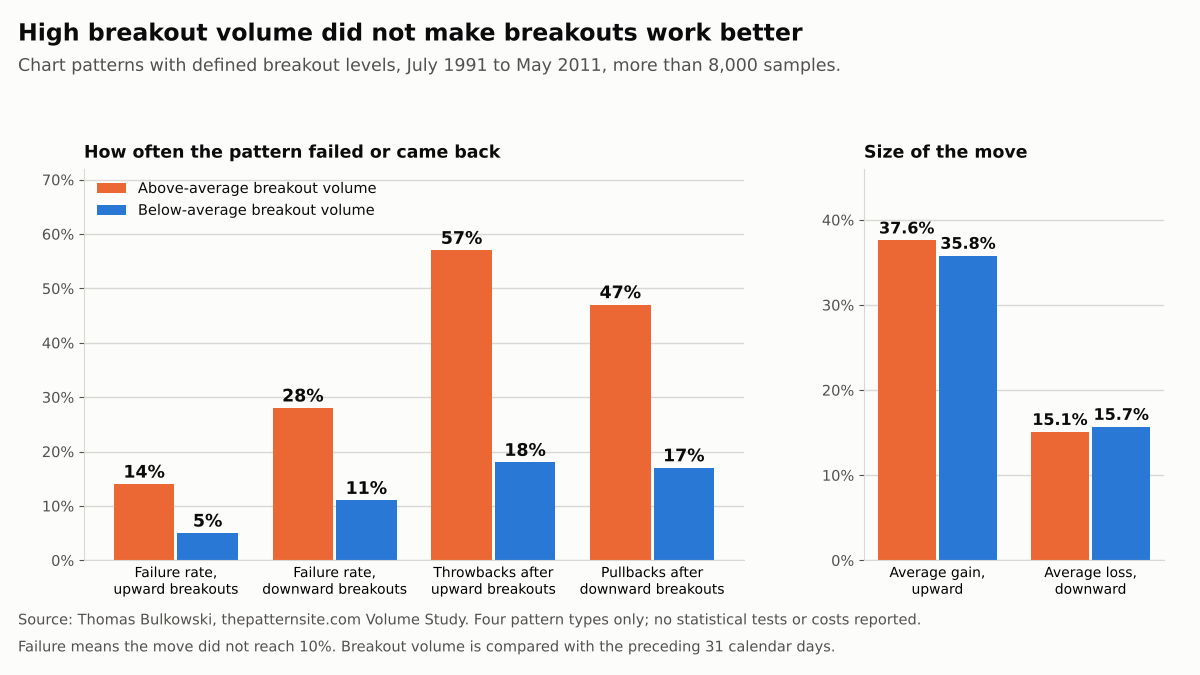
In his Volume Study, upward breakouts on above-average volume gained 37.6%, against 35.8% on below-average volume. Failures were 14% against 5%.
He concludes that the move after a high-volume breakout “isn’t as impressive as many believe”. It is one researcher’s own work, and it tests breakout volume, not divergence.
What Is Missing
I could not find an independent test of OBV or volume divergence as a trading signal. Bulkowski’s divergence tests, for example, cover only RSI.
A recent CXO Advisory review of a volume-shock study found higher overnight returns after volume spikes, but gross of costs. That again is about volume levels.
So the theory is reasonable, the volume research is real, and the specific divergence rule is largely untested in public.
A Forex Caveat
Spot forex has no central exchange. One broker’s guide says that tick volume is an estimate based on your broker’s volume, with no guarantee it matches global activity.
Volume divergence is therefore on firmer ground in stocks and futures than in currency pairs.
A Worked Example
Use the simulated chart. A trader sells short once price falls 1.50 below the second peak, at 117.20. The stop goes 1.00 above the peak, at 119.76, which risks 2.56 per share.
With $200 of risk, the position is 78 shares. A 2 to 1 target is 5.12 lower, and in this simulation it was reached, for about $400. The series was built that way, so real trades will fail more often.
A 2 to 1 target needs a win rate of about one in three to break even, before costs. Our guide to risk-reward ratio and win rate explains the trade-off.
How to Cut the False Signals
- Define the divergence. Fix how far apart the two peaks must be and which volume measure you use before you look at results.
- Check for spikes. If one day is driving the OBV move, treat the signal as weak.
- Wait for confirmation. Require price to break the last swing low before selling, instead of trading the divergence itself.
- Test every divergence, not just the winners, with realistic costs and a held-out period, as in our backtesting guide. Avoid tuning settings until it looks good, which is how overfitting starts.
- Add a price level. Our guide to finding strong support and resistance shows how to judge a signal at a level.
Key Takeaways
Volume carries real information, but volume divergence as a standalone trading signal has little independent testing behind it.