
Chasing a breakout can feel like buying at the top, so many traders wait for the pullback. A breakout retest strategy lets price break a level, drift back to test it, and only then enters if the level holds.
The appeal is clear: a closer stop and some evidence that the break was real. The cost is just as clear, because many breakouts never look back.
This article explains how the retest works, what Bulkowski’s statistics say about how often it happens, and how to compare the two entry styles honestly.
What Is a Breakout Retest?
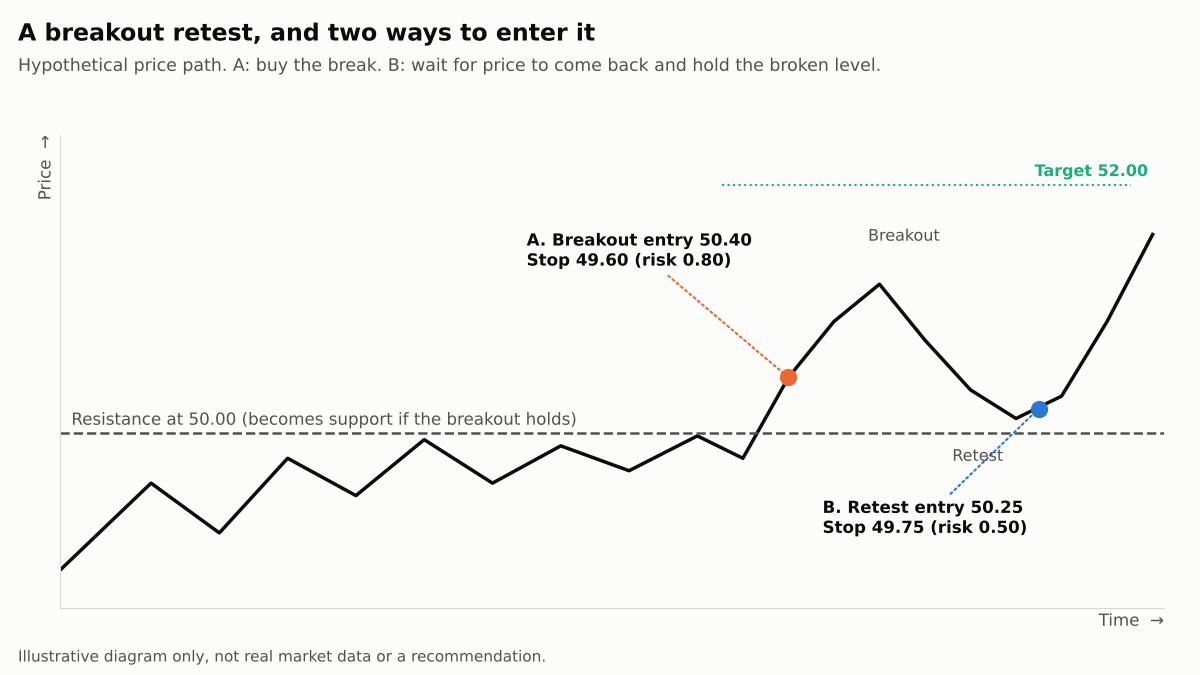
After price breaks above resistance, that old resistance level is often treated as new support. In a retest, price returns to the level, finds buyers and moves away again.
Bulkowski calls this a throwback when it follows an upward breakout and a pullback when it follows a downward one.
The retest entry is the buy (or sell) made when the level holds, rather than on the original break.
Why Levels Can Retest
One explanation comes from order flow. C. L. Osler’s Federal Reserve Bank of New York paper, “Currency Orders and Exchange-Rate Dynamics” (2001), examined stop-loss and take-profit orders at a large foreign exchange dealing bank.
Take-profit orders clustered at round numbers and tended to follow trends, so round numbers could act as partial barriers.
Stop-loss orders sat just beyond round numbers and tended to intensify trends once a level was crossed.
The data came from one bank over about eight months, so it is a hypothesis for why levels matter, not a trading rule.
We looked at related evidence on bounces in our article on the bearish pin bar at support, and our guide to finding strong support and resistance covers how to mark the levels themselves.
How Often Do Breakouts Retest?
Bulkowski reports that across more than 10,000 chart patterns, throwbacks occurred 53% of the time and pullbacks 56%.
So roughly half of breakouts came back to the level and roughly half did not. The figure moves around with the setup. In his volume study of rectangles and double and triple tops and bottoms, throwbacks followed 57% of upward breakouts on above-average volume but only 18% on below-average volume.
A different study of rectangles and broadening patterns found throwbacks in 24% of cases and pullbacks in 32%. The measures and samples differ, which is the point: the retest rate depends on the pattern and on how you define the return.
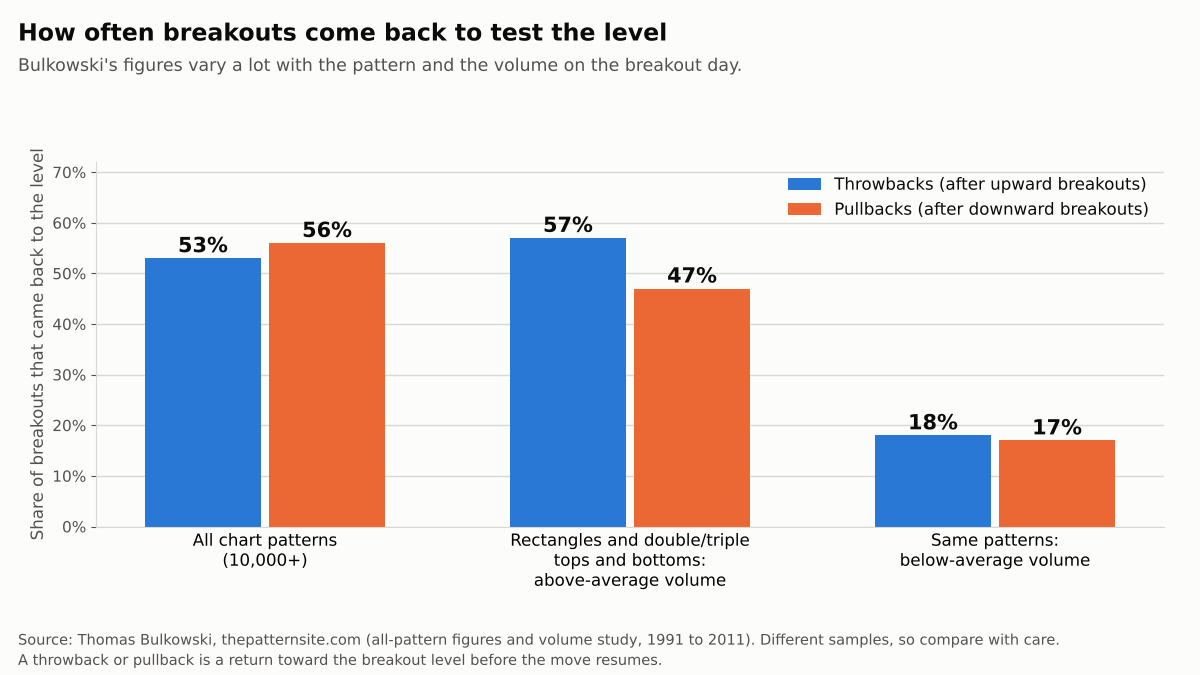
For a retest-only plan this has a direct cost. If about half of breakouts do not retest, you skip about half of them, and those may include the ones that ran without looking back.
Three Outcomes, One Decision
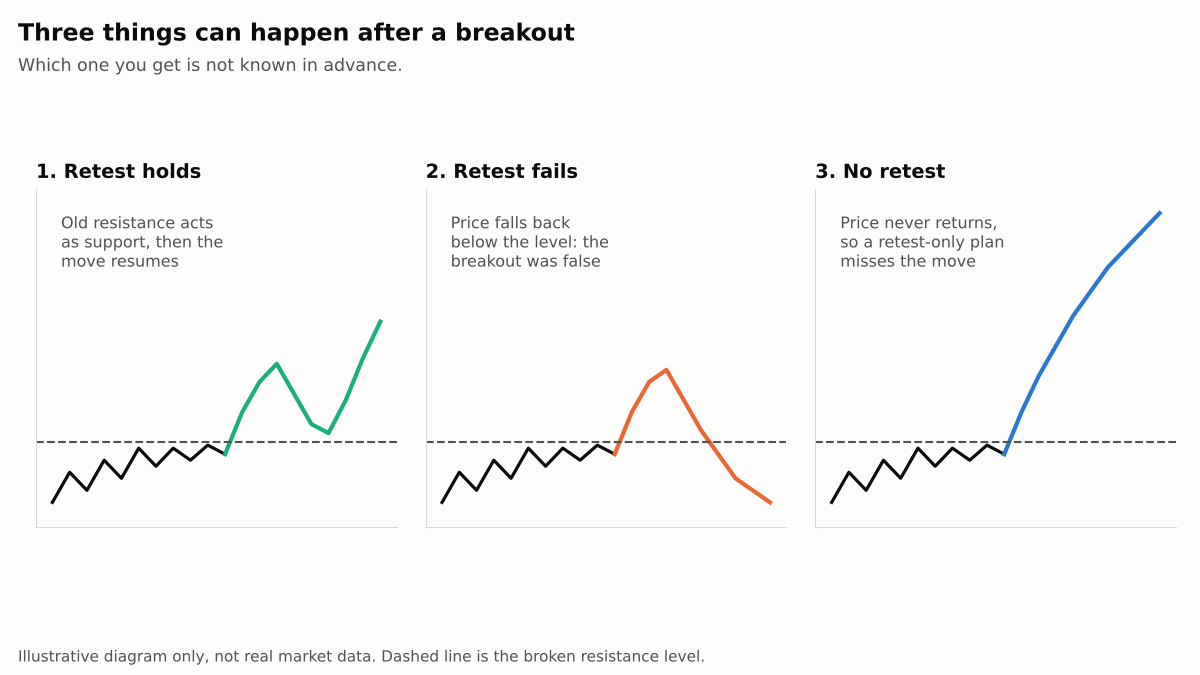
After a break, price can retest and hold, retest and fail, or never return. A retest entry only works in the first case. In the second, the level gives way and the breakout was effectively false. In the third, you are watching from the sidelines.
What the Research Does Not Show
I could not find a study that tests a retest entry rule directly against buying the breakout. The closest classic evidence is on the break itself. Brock, Lakonishok and LeBaron’s 1992 Journal of Finance study tested trading range breaks on the Dow Jones index from 1897 to 1986 and found buy signals produced higher returns than sell signals.
That supports the idea that breaks carry information, but it says nothing about whether waiting for a retest improves on entering early, and it covers a very different market era.
A Worked Example
Suppose, hypothetically, resistance sits at 50.00 and the target is 52.00. Entry A buys the break at 50.40 with a stop at 49.60: risk 0.80, reward 1.60, a ratio of 2 to 1, so you need to win about one trade in three (0.80 ÷ 2.40) to break even before costs.
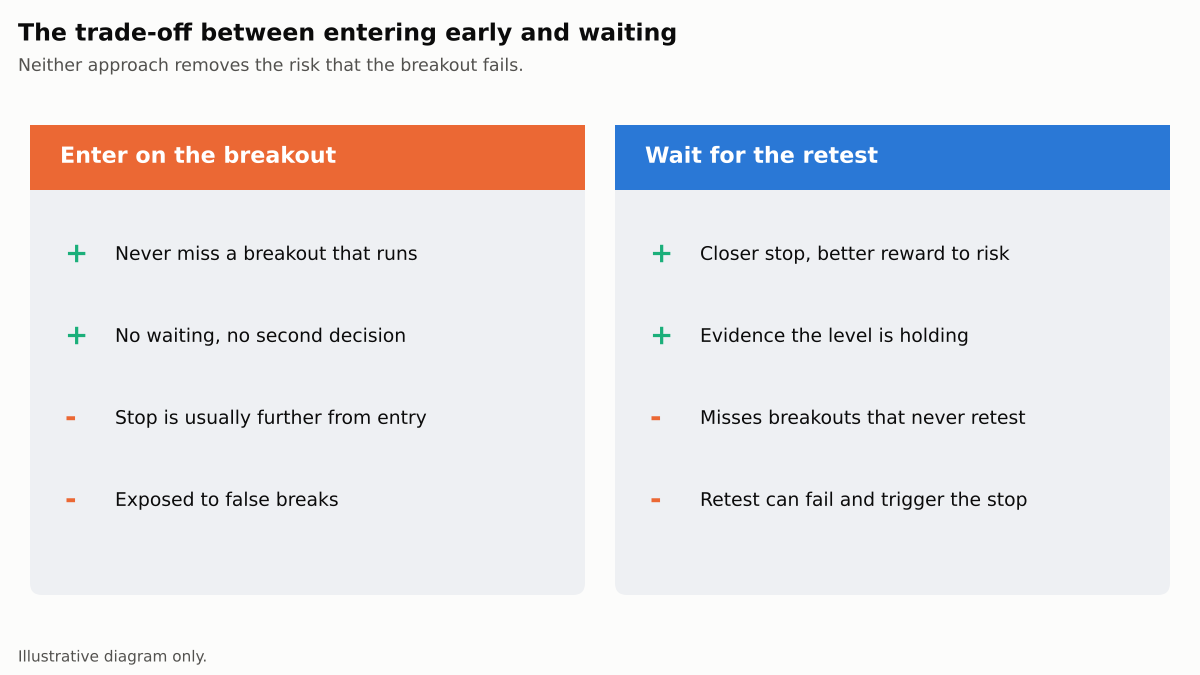
Entry B waits for the retest and buys at 50.25 with a stop at 49.75: risk 0.50, reward 1.75, a ratio of 3.5 to 1, with a break-even win rate of about 22% (0.50 ÷ 2.25). B looks better per trade, but it only exists when a retest occurs, and a tighter stop is hit more easily by normal noise.
Whether the better ratio makes up for the missed trades is something only testing can show. Our guide to risk-reward ratio and win rate explains the trade-off.
How to Test It Fairly
- Define the retest precisely. Decide how close price must come to the level, how many bars you allow, and what counts as holding, before you look at results.
- Test both entries on the same breakouts. Include the breakouts that never retested, otherwise the retest strategy looks better than it is.
- Use realistic costs and a held-out period, as described in the backtesting guide, and resist adding filters until the results look good, which is how overfitting starts.
- Plan for the failed retest. Decide in advance where the trade is wrong, and how you will treat a break back through the level. Our article on the inside bar false breakout shows how failed breaks are tested.
Key Takeaways
A retest entry trades certainty for opportunity: you get a closer stop and some confirmation, but you miss the breakouts that never come back.
Bulkowski’s data suggests about half of breakouts retest, and that the share varies with the pattern and with volume. No study I found shows that waiting beats entering early, so test both on your own market with realistic costs, include the trades you would have missed, and size positions assuming the retest can fail.
This article is for educational purposes and does not constitute financial advice. The worked example uses hypothetical figures. Trading stocks and forex carries a high level of risk, including the potential loss of the full amount invested, and may not be suitable for all investors.
Leave a Reply