
Scroll through enough forex robot sales pages and you’ll eventually spot the same number being used as proof of quality: recovery factor. A vendor will proudly quote “a recovery factor of 6.2” as though it settles the argument on its own. It doesn’t, but it isn’t meaningless either.
Recovery factor is a genuinely useful way to think about risk-adjusted return, provided you understand exactly what it measures and, just as importantly, what it can’t tell you. Used properly, it’s one of several checks that separate a robustly tested EA from one that simply got lucky on a specific stretch of historical data.
This guide covers what forex robot recovery factor actually measures, what counts as a good figure, and why the highest recovery factors you’ll see advertised are often the ones that deserve the most scrutiny, not the least.
What Is Recovery Factor?
Recovery factor is a simple ratio:
Recovery Factor = Net Profit ÷ Maximum Drawdown
If a robot made £6,000 net profit over a test period and its worst peak-to-trough equity dip along the way was £2,000, its recovery factor is 3.0. In plain terms, it asks: how many times over did the strategy “recover” the worst loss it had to sit through in order to reach its final profit?
The appeal is obvious. Net profit alone tells you nothing about the ride you had to endure to get there. A strategy that turns £10,000 into £15,000 by grinding out small, steady gains is a completely different proposition to one that reaches the same endpoint via a 40% drawdown that most traders would have abandoned halfway through. Recovery factor puts a number on that difference.
Why Traders Use It to Judge Forex Robots
Unlike raw profit figures, recovery factor forces a comparison between reward and pain. That makes it useful for a few specific jobs:
- Comparing two robots with different profit targets on a like-for-like, risk-adjusted basis.
- Spotting a system that only looks good because it’s been run at high leverage or aggressive position sizing.
- Getting a rough sense of how long you might realistically need to hold through a losing spell before the equity curve recovers.
- Flagging robots whose profit is built on a handful of lucky trades rather than a durable edge — a low recovery factor despite a decent-looking profit total is often a tell.
None of this makes recovery factor a complete picture on its own — more on that shortly — but it’s a legitimate first filter, and a far better one than net profit alone.
What Counts as a Good Recovery Factor?
There’s no single official threshold, and the “right” figure depends on the strategy style, timeframe and test length involved. That said, the following bands are a reasonable rule of thumb for a multi-year backtest or live track record:
| Recovery Factor | What It Usually Suggests |
|---|---|
| Below 1.0 | The strategy’s worst drawdown was larger than its total net profit. Weak risk-adjusted performance, even if the headline profit number looks fine. |
| 1.0 – 2.0 | Modest. Profit outweighs the worst drawdown, but not by much — a losing streak could still feel uncomfortable relative to the gains made. |
| 2.0 – 4.0 | Solid. A reasonably healthy relationship between return and pain, in line with many genuinely tradeable systems. |
| 4.0 – 6.0 | Strong. Worth a closer look at the underlying logic and sample size to check the result is well-founded rather than a statistical fluke. |
| Above 6.0 (especially on a backtest) | Treat with real caution. Extremely high recovery factors are more often a sign of overfitting, a short/cherry-picked test window, or masked risk (see below) than of genuine skill. |
The chart below illustrates how this banding might look laid out side by side. It uses fictional, made-up EAs purely to show the shape of the relationship — it is not a report on any real product.
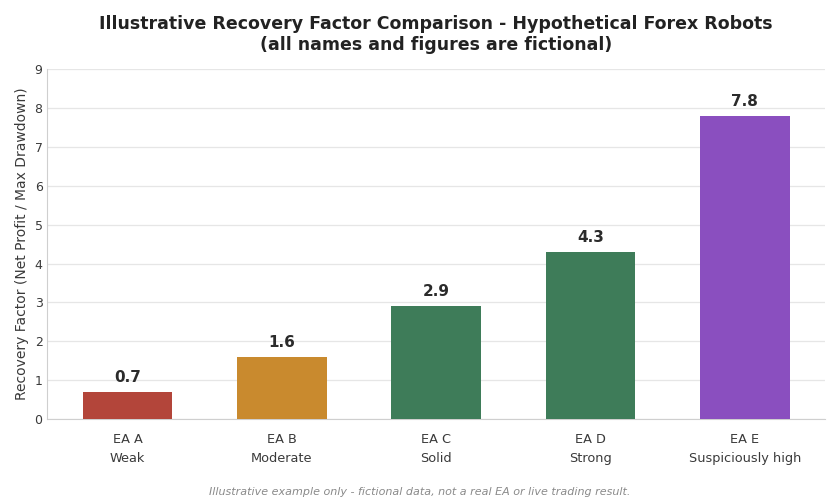
Notice the last bar. A recovery factor that looks too good is worth investigating rather than celebrating, for reasons that come down to how the number is usually produced.
Where Recovery Factor Falls Apart
Recovery factor is a ratio of two numbers, and either one of them can be manipulated, distorted or simply misleading. Here’s how a headline figure can flatter a robot that doesn’t deserve it.
- Overfitting. A strategy tuned aggressively to one specific stretch of historical data can produce a spectacular recovery factor on that exact data, simply because its parameters were chosen with hindsight. The number is real; the edge often isn’t.
- Short test windows. A robot tested over six quiet months might never have encountered the kind of drawdown a full market cycle would eventually produce. A short window that happened to avoid the worst-case scenario will always show an inflated recovery factor.
- Martingale and grid-style staking. These position-sizing methods can suppress the reported maximum drawdown for long stretches by doubling down on losing positions, right up until a losing sequence finally produces a very large, sometimes account-ending, loss. Because that catastrophic drawdown hasn’t happened yet in the test period shown, the recovery factor looks excellent — until it very suddenly doesn’t.
- Cherry-picked date ranges. Starting or ending a backtest at a convenient point can exclude the exact period where the strategy struggled most, inflating the ratio without changing anything about the underlying logic.
- Small sample sizes. A handful of large winning trades can produce an eye-catching recovery factor that has more to do with luck than with a repeatable statistical edge.
A very high recovery factor on a backtest alone should raise your suspicion, not your confidence, until you understand exactly why it’s so high.
How to Use Recovery Factor Properly
None of this means the metric is useless — it means it needs to be read alongside other information, not in isolation. Before treating a quoted recovery factor as meaningful, work through the following:
- Check the length and nature of the test period. A recovery factor from three years covering both trending and ranging conditions carries far more weight than one from a few cherry-picked months.
- Ask whether the figure comes from a backtest, a demo account, or genuine live trading. Live, forward-tested results that hold up over time are worth considerably more than an optimised backtest.
- Check the staking method. If the strategy uses martingale, grid trading, or any form of position sizing that increases exposure after a loss, treat the reported drawdown — and therefore the recovery factor — as potentially understating the real risk.
- Look at recovery factor alongside profit factor, win rate and, crucially, the maximum drawdown figure in isolation. A robot can have an excellent recovery factor and still carry a drawdown large enough that most traders couldn’t tolerate it psychologically or financially.
- Consider sample size. A handful of trades producing a great ratio tells you far less than hundreds of trades doing the same.
Recovery Factor vs Profit Factor vs Expectancy
It’s worth being clear that recovery factor is answering a different question to some of the other statistics you’ll see quoted alongside it. Profit factor (gross profit divided by gross loss) tells you how efficiently a strategy converts winning trades into money relative to losing ones, but says nothing about the shape or size of the drawdowns along the way. Expectancy tells you the average amount you can expect to make or lose per trade, which is useful for sizing positions but, again, doesn’t directly capture the drawdown experience.
Recovery factor’s specific job is to connect total return to the worst single stretch of pain required to get there. That’s a genuinely different and useful angle — but it’s one piece of a bigger picture, not a replacement for the others.
Final Thoughts
Forex robot recovery factor is a useful, quick way to sense-check whether a strategy’s profit was earned in a psychologically and financially sustainable way, or whether it came at the cost of a drawdown few traders would actually sit through. A reasonable, well-supported figure in the 2–4 range, backed by a long and varied test period, is a far more trustworthy signal than an eye-watering number pulled from a short or suspiciously smooth backtest.
Treat recovery factor the way you should treat any single statistic in trading: as one input into a wider judgement, not a verdict in itself. Combine it with an honest look at the staking method, the sample size, and — wherever possible — genuine live forward-tested results, and it becomes a genuinely useful filter rather than a marketing talking point. Trading always carries the risk of loss, and no single ratio, however favourable, changes that.
Leave a Reply