
An earnings gap happens when a stock opens far from its previous close after a company reports results. It is one of the most watched setups in stock trading, because the move can be large and fast.
It is also one of the hardest to trade well. This article looks at how earnings gaps form, what the research says about how big they are and whether they keep going, and how to think about the risk.
What Is an Earnings Gap?
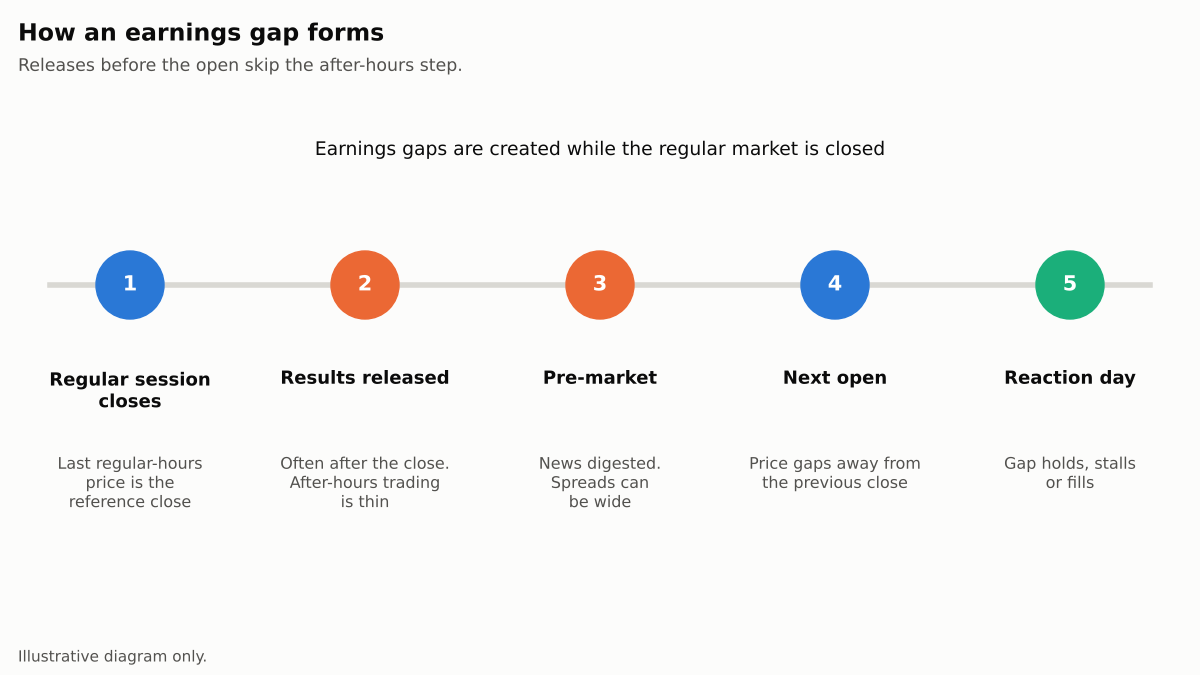
Most US companies report after the market closes or before it opens. The news arrives while the main session is shut.
Trading continues in thin after-hours and pre-market sessions. When the regular session opens, the first price can sit well above or below the prior close. That jump is the gap.
How Big Are Earnings Moves?
A recent study by Equibles Research looked at 12,353 S&P 500 earnings reports from April 2020 to October 2026. The median move was 3.3% and the mean was 4.6%.
About one report in three moved 5% or more. Fewer than one in ten moved 10% or more, and only 1.3% moved 20% or more.
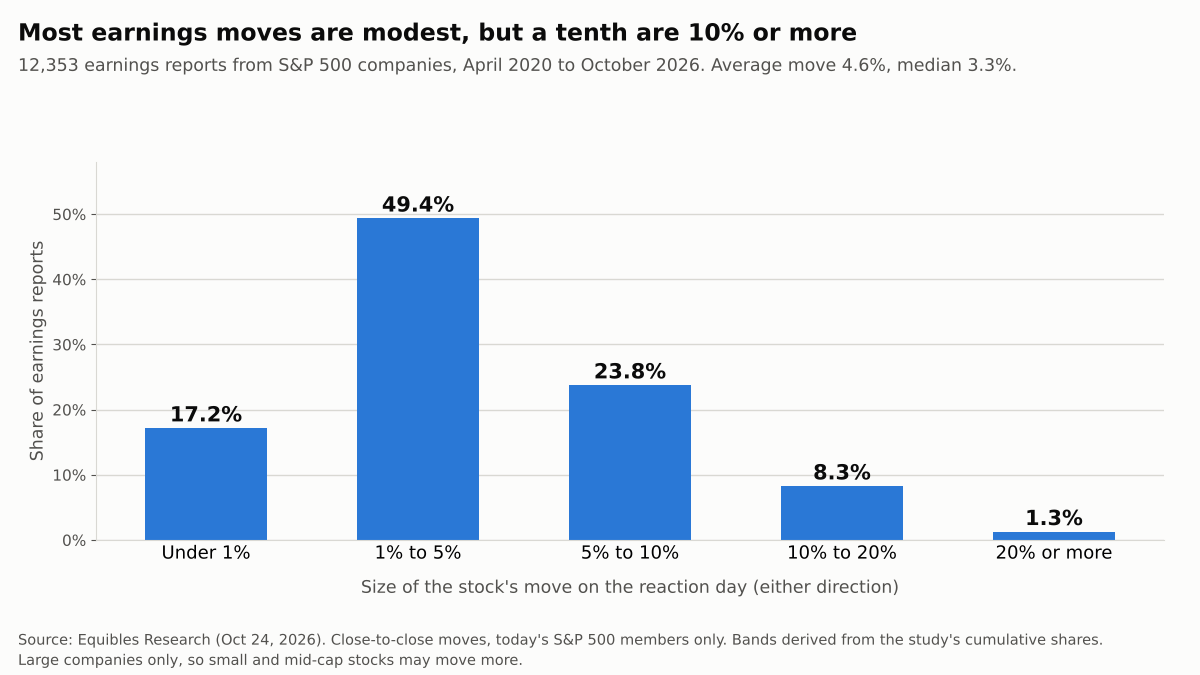
Three cautions apply. The moves are close-to-close, so they are not the opening gap itself. The sample is large S&P 500 companies, and small caps can behave very differently. The authors also note the sample covers only companies in the index today.
Does the Move Keep Going?
Academics call the idea of continuation post-earnings announcement drift, or PEAD. Stocks with strong earnings surprises were found to keep outperforming for weeks afterwards.
That was a long-documented pattern, but it has weakened.
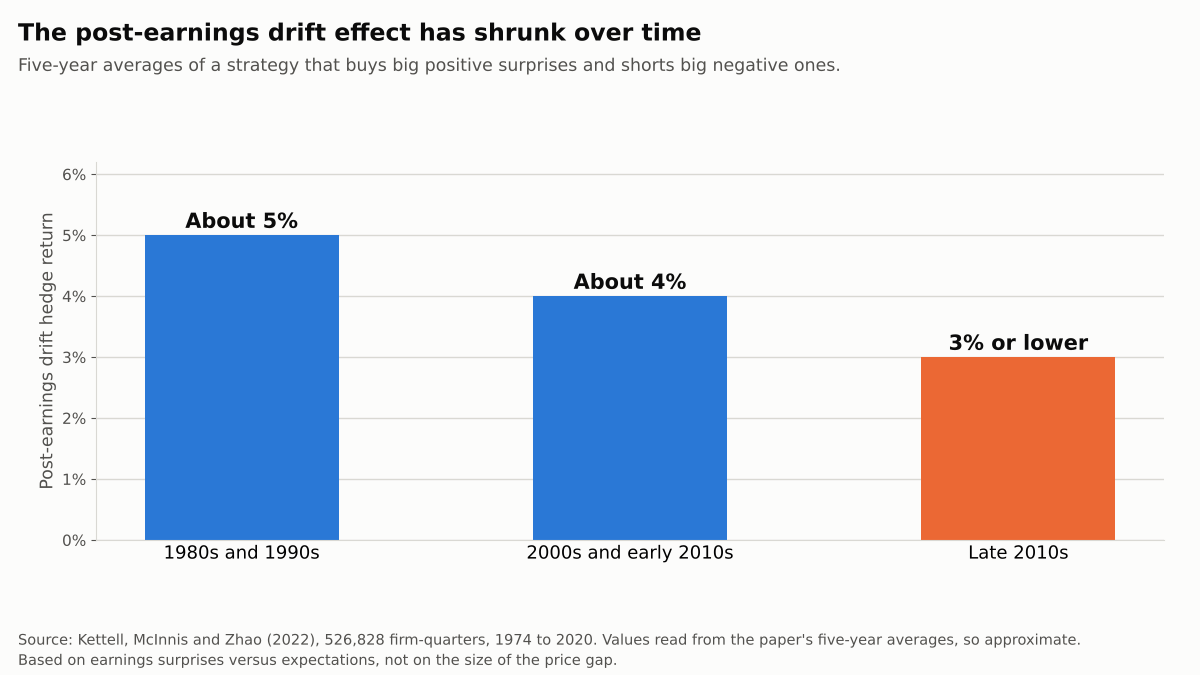
Kettell, McInnis and Zhao studied PEAD from 1974 to 2020. They report the long-short return fell from about 5% in the 1980s and 1990s to about 4% in the 2000s, then to 3% or lower in the late 2010s.
They also report that the abnormal return was indistinguishable from zero after 2017. Their explanation is that earnings news has become less persistent, though more arbitrage trading has also been blamed.
A newer paper goes further. Clinch, He, Landsman and Li find that the link between one quarter’s earnings news and the next quarter’s reaction has turned negative over the past twenty years. The reversal appeared only after positive news.
These are portfolio studies over weeks and months. They do not test a day trader buying a gap at the open, so treat them as context, not proof either way.
The Risks of Trading the Gap
The SEC warns that after-hours trading carries extra risks, including lower liquidity, wider spreads and greater price volatility. Prices can also differ from those in the regular session.
The bigger danger for most traders is the gap past a stop. A stop order is not a guaranteed price. If a stock opens beyond your stop, the order fills at the open, not at your level.
We cover why gaps often fade in our guide to why stocks gap up and then fall. Our failed gap up strategy guide looks at the setup after the gap fails.
Three Paths After a Gap
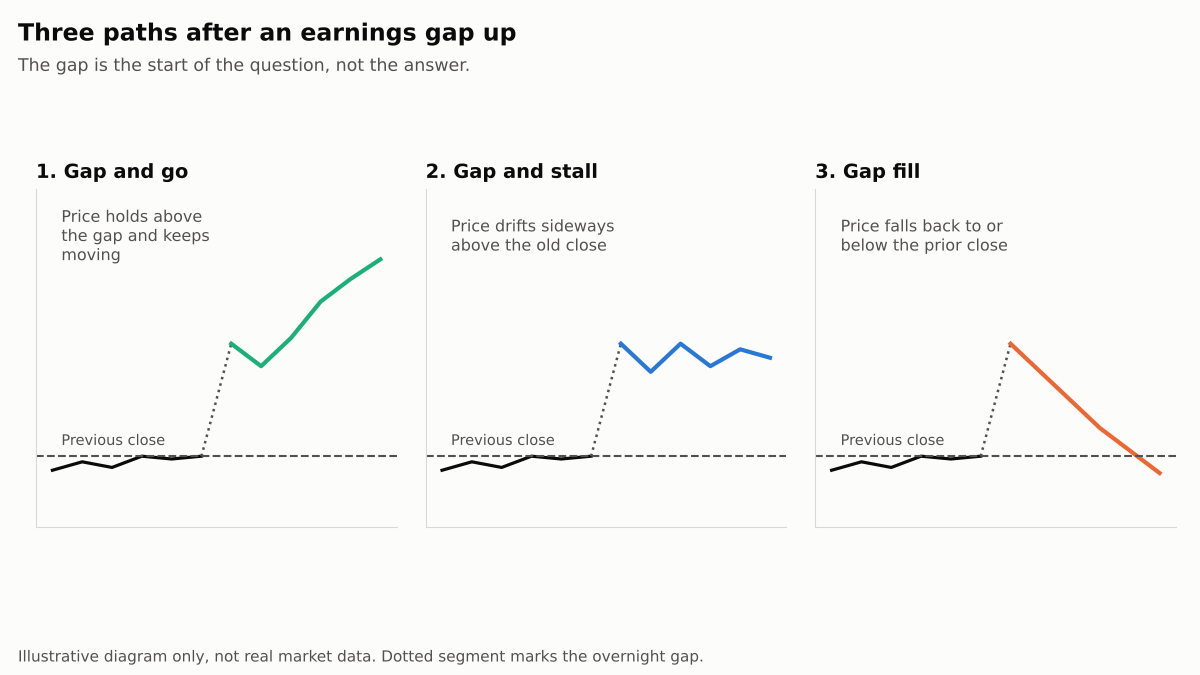
After a gap up, price can keep rising, stall near the open, or fall back to fill the gap. A plan has to cover all three, because you will not know which one you are in at the start.
A Worked Example
Suppose, hypothetically, a stock closes at $100 and gaps up to $106 after earnings. You wait for the first pullback to hold and buy at $106.50, with a stop at $104.50 and a target at $110.50.
You risk $2.00 to make $4.00, a 2 to 1 ratio. You would need to win about one trade in three to break even, ignoring costs. With $200 of risk per trade, the position is 100 shares.
Now compare holding through earnings. You own 100 shares bought at $100 with a stop at $97, a planned loss of $300. The company disappoints and the stock opens at $90.
Your stop fills near $90, a loss of $1,000. That is more than three times the planned risk. See our guide to risk-reward ratio and win rate for how the numbers trade off.
How to Test an Earnings Gap Strategy
- Define the setup in advance. Write down the minimum gap size, the entry trigger and the stop before you look at results.
- Separate gap up from gap down. The evidence above suggests positive and negative news may not behave symmetrically.
- Use realistic costs and fills. Include wide spreads at the open and slippage, and follow the steps in our backtesting guide.
- Avoid curve fitting. Adding filters until the results look good is how overfitting starts.
- Plan for the worst gap. Size positions so a gap through your stop is survivable, and see how losses compound in our article on drawdown.
Key Takeaways
Earnings gaps are common and sometimes large, but the research does not show that the move reliably continues.
Drift has faded in the academic data, and the evidence is about portfolios, not day trades. Test any gap plan on your own market with realistic costs, and assume the gap can go through your stop.