
Grid trading strategies have a reputation for looking almost boringly reliable — a steady climb, small regular profits, month after month. That reputation is exactly why they sell well, and exactly why they catch so many traders out. A grid strategy can genuinely hold up for a long time in the right conditions. The trouble is knowing whether you’re looking at a sound approach or a risk that simply hasn’t shown up yet.
This guide explains how grid trading actually works, where the real risk sits, and what to check before you let a grid EA anywhere near a live account.
What Is a Grid Trading Strategy?
A grid strategy places orders at fixed intervals above and below a starting price, forming a “grid” of levels. As price moves through each level, a new position opens. Some grids only trade in one direction — adding to a position as it moves against you, in the hope that price eventually reverses. Others are two-sided, placing both buy and sell orders so that whichever way price moves, something is triggered.
The strategy doesn’t need to predict direction correctly to produce a profit on any single rung — it just needs price to move enough for a level to be hit and, eventually, for enough of those positions to close in profit as price oscillates. That’s what makes it look so consistent in calm, range-bound conditions.
Why Grid Strategies Look So Good, So Often
Markets spend a lot of their time moving sideways within a range. In that kind of environment, a grid strategy can rack up a long run of small wins, because price keeps drifting back through levels that were already open. The equity curve climbs steadily, the drawdowns look shallow, and the whole thing feels low-risk.
That steadiness is a feature of the market condition, not proof that the strategy is safe. A grid strategy hasn’t been tested by a real trend until it has actually lived through one. Plenty of grids that looked flawless for six or twelve months have unravelled in a matter of days once price broke out and kept going.
Where the Real Risk Comes From
A grid’s weak point is simple: it has no built-in view on when to stop adding positions. Every level price passes through against the open exposure adds another position, and every one of those positions is now floating at a loss until price comes back. In a genuine trend, price doesn’t come back — or not soon enough — and the number of open, losing positions keeps growing.
Two things tend to make this worse rather than better:
- Increasing lot sizes per level. Some grid EAs increase the size of each new position as the grid extends, which is functionally very close to a martingale system — exposure grows exponentially rather than steadily.
- No hard stop on the whole basket. Many grids are sold with “no stop loss” as a selling point, on the logic that price always comes back eventually. That logic holds right up until it doesn’t, and by then the floating loss can be far larger than the account can absorb.
Types of Grid Strategies You’ll Come Across
- Single-direction grid. Adds only in one direction as price moves against the original position — closest in spirit to a martingale system.
- Hedged (two-sided) grid. Places both buy and sell levels, so exposure builds on whichever side price moves toward.
- Fixed lot size grid. Each new level opens the same position size — exposure grows steadily rather than exponentially.
- Escalating lot size grid. Each new level is larger than the last — exposure and potential loss grow far faster as the grid extends.
- Take-profit basket grid. Closes all open positions together once the combined basket reaches a target profit, rather than managing each position individually.
The Maths: How Exposure Grows With a Trending Market
The table below illustrates the difference a fixed lot size makes compared with an escalating one, using a simple example: a grid that opens a new position every time price moves one level against it, starting from 0.01 lots.
| Levels triggered | Total lots open (fixed 0.01 per level) | Total lots open (lot size doubles each level) |
|---|---|---|
| 1 | 0.01 | 0.01 |
| 2 | 0.02 | 0.03 |
| 3 | 0.03 | 0.07 |
| 4 | 0.04 | 0.15 |
| 5 | 0.05 | 0.31 |
| 6 | 0.06 | 0.63 |
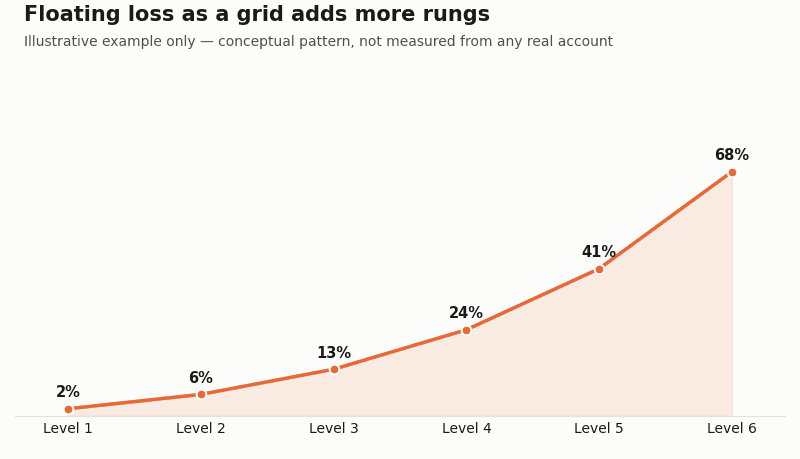
Even a strategy with no escalation still sees exposure climb steadily as a trend continues. With an escalating lot size, the same trend produces exposure more than sixty times larger by the sixth level — and the floating loss grows just as fast. The chart below shows the same idea in terms of the loss itself.
Warning Signs When a Grid EA Is Being Sold to You
- “No stop loss” presented as a benefit. Ask directly what happens if price simply doesn’t come back. If there’s no answer beyond “it always has before,” treat that as a red flag rather than reassurance.
- Only a short or calm-market track record. A grid that has only been live during range-bound conditions hasn’t been tested by the scenario that actually matters.
- No mention of maximum exposure. A seller should be able to tell you the largest number of open positions, and the largest floating loss, the system could realistically reach.
- Escalating lot sizes described vaguely. If position sizing “adapts” or “optimises” without a clear, fixed rule, assume it can grow faster than you’d expect.
- A smooth equity curve with no discussion of drawdown. As with martingale systems, the total return figure tells you very little without the maximum drawdown sitting next to it.
Is There a Safer Way to Use Grid Concepts?
Grid-style averaging isn’t inherently reckless — what makes it dangerous is running it without limits. A bounded version, with a fixed maximum number of levels, a fixed lot size that never escalates, and a hard stop on the whole basket once a defined loss is reached, behaves very differently to an EA left to add positions indefinitely. The difference is the same one that separates disciplined position sizing from martingale staking: knowing your absolute worst case before you place the first trade, rather than discovering it during a live trend.
Final Thoughts
A grid strategy’s smooth equity curve tells you how the market has behaved recently — not how the strategy will behave once it does. The real test of a grid EA is a genuine trending market, not a backtest or a few calm months live. Before running one, work out the maximum number of levels it can reach, the lot sizing rule behind each one, and the worst-case floating loss that implies. If a seller can’t or won’t answer those questions clearly, treat the track record as unproven.
This article is for educational purposes and does not constitute financial advice. Trading forex carries a high level of risk and may not be suitable for all investors.
Leave a Reply